With volatility running rampant on Wall Street amid the coronavirus outbreak and ensuing stock market correction, the Chicago Board Options Exchange (CBOE) Volatility Index (VIX), or “fear gauge” or “fear index,” is rocketing upward — but exactly what is the VIX and how does it work?
First, it’s important to understand what volatility is in relation to the stock market. Volatility measures price swings, both up and down, over a certain period of time. Simply put, the wilder and faster the swings, the more volatile the market is.
Volatility can be measured using historical price swing data, known as “realized volatility,” or it can be a measure of expected future volatility implied by options prices.
What Is the VIX and How Is It Calculated?
The VIX was created in 1993 and later updated in 2003 to measure in real time the stock market’s expected volatility over the next 30 days. It is a measure of expected future volatility based on call and put options placed on S&P 500 stocks by traders (click here for our guide on how to trade options). The S&P 500 (SPX) index is considered a leading indicator of the U.S. stock market as a whole and investors use it to measure the level of risk in the market.
The VIX estimates how volatile the market will be by aggregating the weighted prices of S&P 500 puts and calls over a wide range of strike prices. More specifically, the VIX is calculated by looking at the midpoints of real-time S&P 500 option bid and ask prices.
Standard SPX options expire on the third Friday of each month and weekly S&P 500 options expire on every other Friday. Only SPX options that expire on Friday are used to calculate the VIX, and they are weighted to yield a constant maturity 30-day measure of the expected volatility of the S&P 500 index, according to CBOE.
Intraday VIX values are based on SPX option bid and ask quotes every 15 seconds, and the intent is to provide expected volatility at a particular point in time, so they are often called “indicative” or “spot” values. The VIX spot values are calculated between 3:15 a.m. ET and 9:15 a.m. ET, and again between 9:30 a.m. ET and 4:25 p.m. ET.
For you math whizzes out there, here is the generalized formula used to calculate the VIX:

What Scores Imply Future Stability or Volatility?
Going by VIX calculations, if traders expect 1% daily swings up or down on the market the VIX score is 20, which is roughly the index’s long-run average. So under 20 is little volatility, around 20 is average and the bigger the score above, the bigger the swing expected in prices.
With the S&P 500 falling more than 7% Monday and the market in general being a bloodbath amid coronavirus fears and a new oil price war, the VIX is running quite high, which implies a volatile market for the next month.
The VIX closed at 54.46 Monday and opened at 49.68 Tuesday before ticking as high as 55.66.
Just for comparison’s sake, below is the latest VIX chart dating back one year. As you can see, the index is showing the highest volatility — by far — in the past year coming for the month ahead.
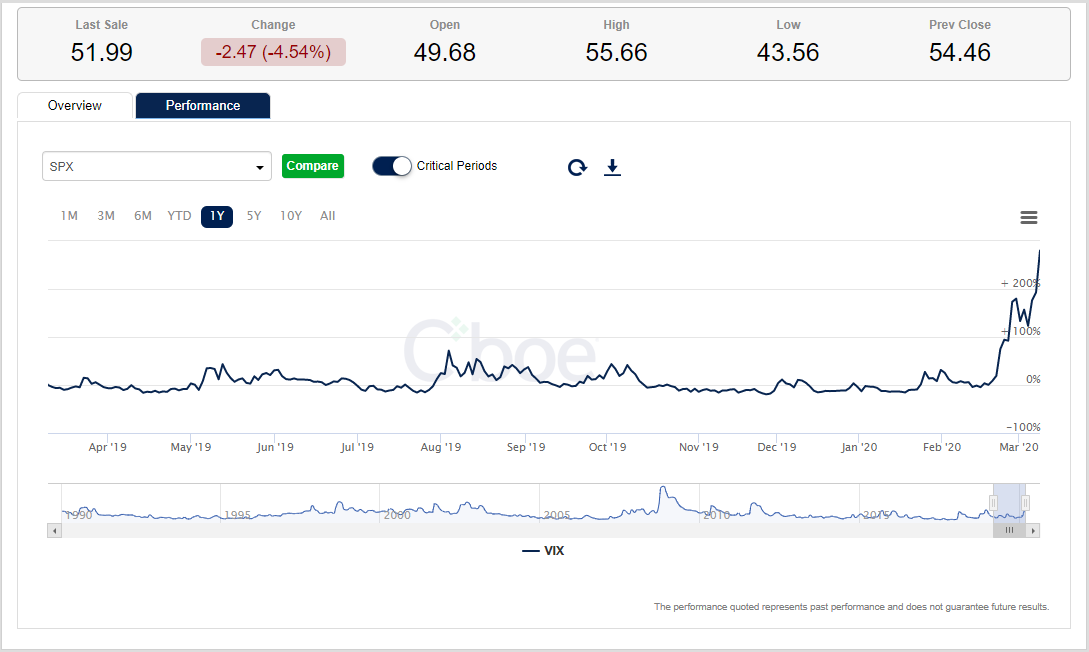
Click here to go to the CBOE website and tinker with the VIX yourself if you’d like to run some different comparisons and for future use.
RELATED:
It’s a Time for Market Volatility, But Here’s How You Can Be Greedy
Goldman Sachs: Strap in for a Wild October on Wall Street
Wall Street: Trade War Escalation Now Puts Entire 2019 Rally at Risk