
Supply and demand determine market prices.
Analysts look for clues as to which factor is more important.
Chart patterns work well in describing these clues.
The patterns help analysts find support and resistance levels through visual analysis.
Why Support and Resistance Levels Matter
Support is a level where we expect buyers to enter the market.
It could be that they think prices are cheap.
Resistance is a level where we expect sellers to take advantage of high prices.
Previous price action can determine the levels.
For example:
- A stock has fallen to a certain price in the past.
- Traders see that on the chart.
- They buy expecting that history will repeat.
At high prices, resistance follows a similar process, with sellers worried that prices will fall as they did in the past.
That’s the standard way to spot support and resistance.
We can also find support and resistance levels with hard data.
The chart below shows the support for bitcoin using a quantitative approach.
Price is right at support, and a small dip in price could lead to a strong sell-off.
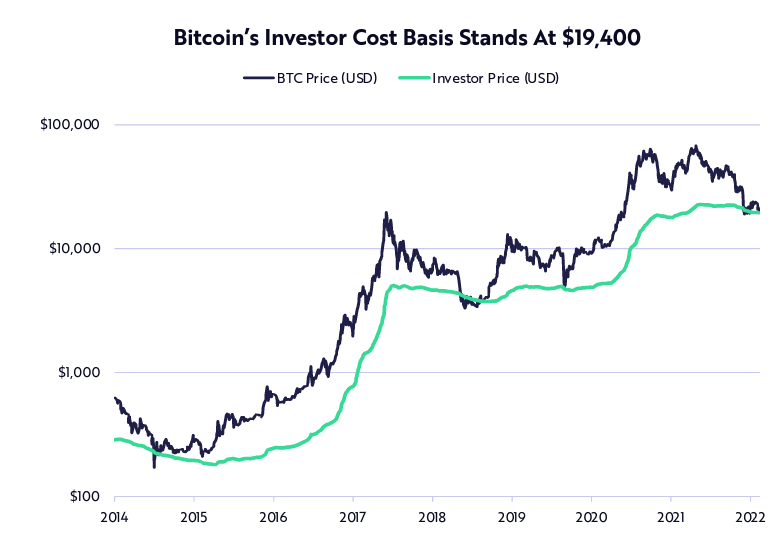
Source: ARK Invest.
For this chart, the support level is the average price investors paid for their positions.
This is an essential level for the market.
What’s Going on With Bitcoin’s Support and Resistance?
If bitcoin falls below that level, the average investor shows a loss in their account.
The sole reason bitcoin has gone up is because average investors believed the price would go up.
They bought expecting gains.
This belief diminishes when their accounts show a loss. That could lead to rapid selling.
It’s rare that bitcoin trades at this level.
In the past, the price bounced off this support line.
This support level has held in place for eight years.
Bottom line: While bitcoin passed this test a few times in the past, the market was different.
Traders believed the price could only go up.
Now they know the price can fall.
They also know the price can fall far.
Of course, prices can fall further even after a steep fall.
That’s the risk in the current market.
Click here to join True Options Masters.