
Investors often think of October as the most bearish month of the year, or perhaps this month because of the age-old “sell in May and go away” refrain on Wall Street. That’s mostly because of their personal perceptions.
Many investors experienced, or at least heard of, the October 1987 crash. They also recall hearing about October 1929 when the Dow Jones Industrial Average fell more than 37%. More recently, October 2019 also was the beginning of a three-month fall that ended just after Christmas.
Data doesn’t support the image of October as the worst month of the year. October is up more often than not. The chart below shows the percentage of time the Dow Jones Industrial Average showed a gain in each month since 1900.
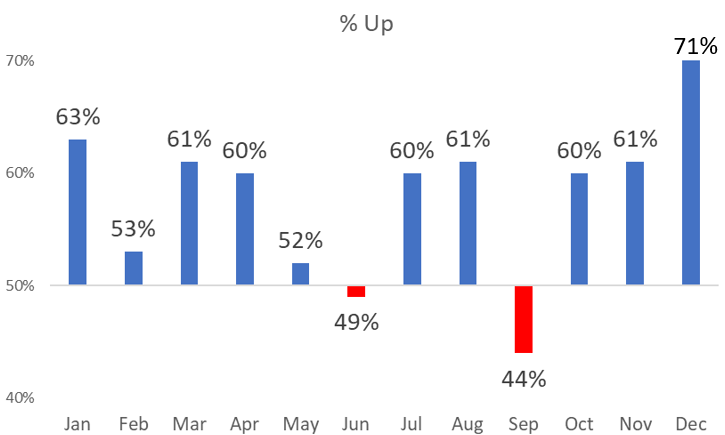
Data actually says September is the most bearish month of the year. That may be surprising, but the bigger surprise for investors might be the potential for a June swoon.
Skeptics will insist the chart includes too much data. Markets are different now than they were 120 years ago.
That’s true.
Direct investing in indexes became widely available in the 1990s as exchange-traded funds were introduced. In 1998, an ETF tracking the Dow was introduced.
The June Swoon
The next chart uses data only from 1998, using SPDR Dow Jones Industrial Average ETF Trust (NYSE: DIA). The details are a little different, but the June swoon remains, and June is now the weakest month.
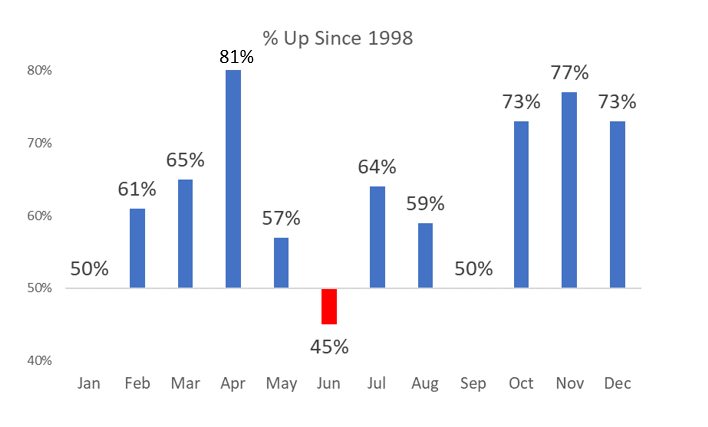
The June swoon is a market trend that has withstood the test of time. Similar results are seen in other ETFs tracking small-cap stocks, tech stocks and other broad market indexes.
One reason for the weakness could be tax-related selling pressure. Quarterly income tax payments are due in June, but payments are also due in January, April and September. At best, this seems to explain just part of the weakness.
More likely, the reason for lackluster performance in June is just a lack of interest in stocks. Summer vacations, June weddings and other activities compete for attention. This could explain why volume is generally below average, hence the June swoon.
Whatever the reason, the results are clear. June is historically among the worst performing months of the year.
• Michael Carr is a Chartered Market Technician for Banyan Hill Publishing and the Editor of One Trade, Peak Velocity Trader and Precision Profits. He teaches technical analysis and quantitative technical analysis at New York Institute of Finance. Mr. Carr also is the former editor of the CMT Association newsletter Technically Speaking.
Follow him on Twitter @MichaelCarrGuru