

Lumber has been one of the hottest markets in the past few months.
Prices soared, rising more than 540% from their pandemic lows to the May highs. The rally was driven by a shortage of sawmill capacity rather than a shortfall of trees.
As Bloomberg reported during the bull market:
Trees themselves are dirt cheap in places like Louisiana, where timber supplies are plentiful.
The so-called stumpage fee, or what lumber companies pay to land owners for trees, [reached] the lowest since 2011.
An abundance of harvest-ready trees has kept stumpage fees extremely low across the U.S. South, home to half of the country’s production.
In the past month, lumber futures dropped more than 40%. While some argue the bull market is over, there are technical reasons to expect the rally to resume.
Lumber Future’s 40% Drop
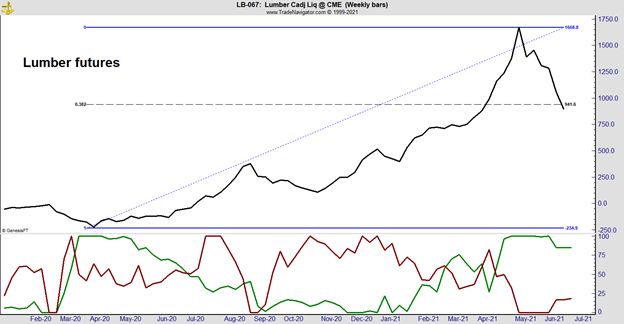
Source: Trade Navigator.
Fibonacci Ratios Show “Smart Money” Is Bullish on Lumber
After a rally, traders look for prices to pull back, retracing a part of their gains. Many traders plot retracement lines to show important price levels. Popular lines use Fibonacci ratios. The black dotted line in the chart shows that lumber has now retraced 38.2% of its rally.
Fibonacci ratios are popular among traders. There’s nothing magical about the ratios even though some traders believe the numbers possess supernatural qualities.
The truth is that Fibonacci ratios are built into the most popular software platforms. So, because they’re there, traders use them. It’s that simple.
Hedge fund traders draw their ratios and buy or sell contracts when prices touch the ratios.
The lines enforce discipline, and successful traders need a disciplined approach. Because the exact same lines are on so many charts, Fibonacci ratios become important.
Fibonacci ratios aren’t important enough to be the only tool a trader will need. But they’re useful when combined with other reasons to trade.
For lumber, a reason to expect higher prices is shown at the bottom of the chart. This is an indicator based on the Commitment of Traders report. This report tells us who is buying lumber, soybeans, and other commodities.
Analysts call one group “smart money.” This group tends to be right about major trends more often than not. In the report, this group is called commercials.
For lumber, commercials include sawmills, homebuilders and other companies that use wood. Buying and selling futures allows commercials to reduce risks associated with changes in the price of the raw material.
The COT report also shows the positions of small traders. They are often wrong in the futures markets.
WOOD ETF Adds Lumber Exposure
In the chart, the position of commercials is shown as the green line. The position of small traders is shown in the red line. To make the data easier to understand, the lines show degrees of bullishness or bearishness over the past six months. High values are bullish.
Now, commercials, the green line are the most bullish they’ve been in six months. Small traders are at their most bearish.
This tells us smart money is bullish while not-so-smart money is bearish. In the past, “smart money” has usually been right when there’s a difference of opinion like this.
To side with “smart money,” investors should consider adding exposure to lumber. While futures are not the best choice for many investors, an ETF like iShares Global Timber & Forestry ETF (Nasdaq: WOOD) could be attractive.
I don’t like working more than I have to.
That’s why I found a way to beat the market by making one simple trade per week.
Last year, this trade helped me beat the market eight times over.
It’s a great way to accelerate your gains. Click here, and I’ll show you how it works.
Michael Carr is a Chartered Market Technician for Banyan Hill Publishing and the Editor of One Trade, Peak Velocity Trader and Precision Profits. He teaches technical analysis and quantitative technical analysis at the New York Institute of Finance. Mr. Carr is also the former editor of the CMT Association newsletter, Technically Speaking.
Follow him on Twitter @MichaelCarrGuru.


