
Moving averages (MAs) are a popular technical indicator. They are widely used to define whether we’re in an uptrend or downtrend.
A moving average is an average of the closing prices. It moves with the data and always uses the most recent closes. For example, a 200-day MA will use the 200 most recent closes. Tomorrow, the oldest data point will drop, and the most recent close added so that there are always 200 days in the calculation.
When prices are above the MA, the trend is defined as up. A downtrend is defined as times when the closing price is below its MA.
Any number of days can be used in the MA. The 200-day MA is popular to define the long-term trend. The 50-day MA is used to define the direction of the short-term trend.
Another way to use MAs is to find times when a short-term reversal in prices is likely.
This is based on the idea that the stock market is like a rubber band sometimes. Like the rubber band, when prices stretch too far, they tend to snap back quickly in a market pullback. To define when prices stretch overtly, some analysts use the 50-day MA.
This is shown in the chart of the SPDR S&P 500 ETF (NYSE: SPY) below. The blue line is the 50-day MA.
SPY Overextension Is Set to Pullback
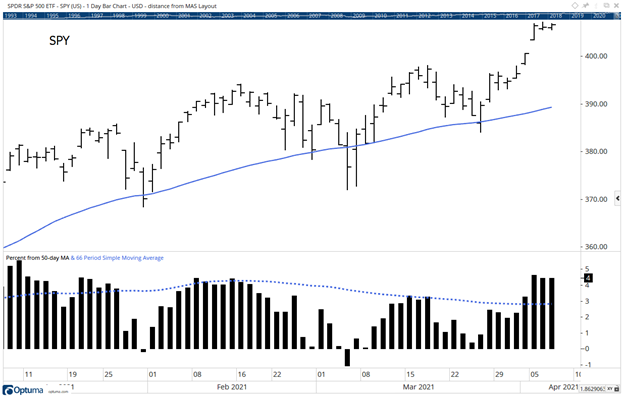
Source: Optuma.
Market Pullback Could Be the Start of a Downtrend
The bars at the bottom of the chart show how far the closing price is from the 50-day MA. Large deviations from that average are often followed by short-term reversals.
Last week, SPY peaked at more than 5% above its MA. In the past, if you had bought when that happened, you would have lost money most of the time. History shows that, on average, SPY declines in the week after that signal.
A decline is likely this week. It will be important to watch the price action as that decline unfolds to determine if this is a market pullback within an uptrend or the beginning of a downtrend. There’s a strong possibility it will be the beginning of a downtrend.
I don’t like working more than I have to.
That’s why I found a way to beat the market by making one simple trade per week.
Last year, this trade helped me beat the market eight times over.
It’s a great way to accelerate your gains. Click here, and I’ll show you how it works.
Michael Carr is a Chartered Market Technician for Banyan Hill Publishing and the Editor of One Trade, Peak Velocity Trader and Precision Profits. He teaches technical analysis and quantitative technical analysis at the New York Institute of Finance. Mr. Carr is also the former editor of the CMT Association newsletter, Technically Speaking.
Follow him on Twitter @MichaelCarrGuru.