Have you ever had a close look at a stock on a chart and gotten a “feel” for where it would go next?
Well, you’re not alone. Many investors make decisions on what to buy and what to sell the same way.
And I can’t totally fault the approach.
The entire field of technical analysis is based on the idea that the historical price path of a stock is all you need to make forecasts about future moves.
I’m a Chartered Market Technician (CMT) … so I can’t knock technical analysis and certainly not its emphasis on price action.
That said, traditional “chartist-style” technical analysis has an Achilles’ heel: It’s quite subjective.
It relies heavily on the look and feel of a stock chart. And even though technical analysts use discipline to follow strict rules when making assessments, we still risk allowing our biases to creep in and cloud our judgment.
One way to combat that risk is to incorporate more strictly quantitative approaches in your investment process. That’s exactly what we do in Green Zone Fortunes when we rely on my six-factor stock rating model to point us to the market’s best stocks.
The Green Zone Ratings model quantifies a stock’s strength based on 75 individual metrics, which fall into one of six factors proven to identify market-beating stocks.
In short, we don’t rely solely on looking at a stock chart; we quantify 75 metrics that influence how that stock’s price will move in the future.
This approach is akin to the so-called “Moneyball” strategy that was popularized in baseball during the early 2000s.
I wrote about this story in my book on the Momentum Principle and three systematic ways to profit from it.
My publisher agreed to let me share the excerpt with you today since it provides an excellent reminder of why we leverage Green Zone Ratings.
The Moneyball Approach
In 2003, Michael Lewis wrote the book Moneyball. It was turned into a movie in 2011.
The story chronicles Oakland A’s general manager, Billy Beane (played by Brad Pitt in the film), and his unique approach to assembling a winning team.
You see, Beane had limited resources. He had just $44 million to allocate to players’ salaries in 2002, while other teams, like the New York Yankees, were spending north of $125 million.
But what Beane lacked in spending power, he more than made up for with ingenuity.
Essentially, he figured out the secret to finding the league’s most valuable, underpriced talent. That secret boiled down to two things…
- Billy Beane valued quantitative data over qualitative information. He trusted statistics over his gut. This approach was almost unheard of at the time. Most scouts stuck to “old school” approaches. They’d visit prospects in person and assess the look and feel of their performance. They relied on their experience to guide them through a subjective selection process. Everyone was going on gut feel — except for Billy Beane, who relied on hard numbers and objective evidence instead to evaluate the potential value of prospects.
- Beane focused solely on the variables that actually mattered, the few player statistics that have predictive value … and he ignored everything else. For instance, Beane figured out that two statistics — on-base percentage and slugging percentage — were more predictive of a player’s value than any qualitative assessment of his size, strength or look.
So Beane focused on those statistics while other scouts in the league ran around from city to city trying to judge players by “star power” or how they fit the image of what a future superstar should look like.
Do you ever find yourself doing that sort of thing? Do you go on what feels like a wild-goose chase for the “next hot stock?”
Do you try to read through all the headlines … and make a gut-feel assessment of who the winners and losers will be?
It’s a common mistake.
Just like most baseball scouts before Billy Beane and Moneyball, a lot of investors make the mistake of thinking they can “spot” the next big winner with their bare eyes.
Trust me … you can’t!
You can’t “see” the Momentum Principle. So, what you’re trying to “buy high and sell higher,” unfortunately, may turn out to be a big load of disappointment if you don’t keep a keen eye on the numbers … and only the ones that actually matter!
And that’s why I always preach that if you’re committed to following the Momentum Principle, it’s best to have a proven system — one that can tell you exactly what to buy … when to buy it … and when to sell.
The Green Zone Ratings System
I hope you enjoyed that excerpt. This “Moneyball” approach is precisely what I had in mind when I developed my six-factor Green Zone Ratings model.
It helped me find the latest stock that was added to the Green Zone Fortunes model portfolio last month.
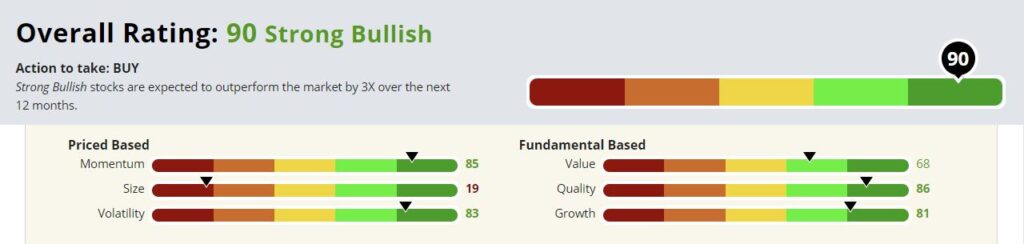
This stock is “Strong Bullish” and exemplifies the “buy high … sell higher” approach with a momentum score of 85.
If you’d like to learn more about the Momentum Principle, check out the details on my Millionaire Master Class here. If you join now, you’ll gain access to the rest of my book, along with monthly stock recommendations and guidance on when to buy and sell. It’s all based on my system that I used to “retire” at 33!
I hope you’ll join us!
To good profits,

Adam O’Dell