
Years ago, inflation disappeared.
That’s what all the official data says.
Consumer Price Indexes and other Federal Reserve measures show prices aren’t rising.
Economists look at data in charts like the one below. It shows the average price of a loaf of bread in the U.S. in the last 40 years.
Stagnation in the Cost of Bread
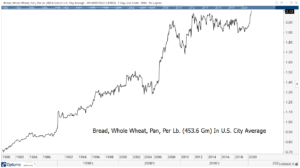
Source: Optuma
Since 2000, the price of bread rose an average of 0.6% a year. Since 1980, the price increased less than 3% a year.
Economists believe inflation means that prices of things like bread rise slowly. That is an excellent academic definition. But the real world is more complex.
Inflation Is Hiding in the Housing Market
In the real world, hidden inflation can make it impossible for producers to deliver low-priced goods. This won’t boost inflation indexes because there are no sales of the products.
For example, if the price of wood and other construction materials rise too much, builders will stop building affordable housing.
You can see this in the next chart:
New Affordable Housing Sinks
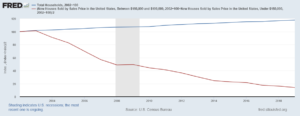
Source: Federal Reserve
This is a chart of affordable new homes (the red line) compared to the growth of households in the U.S. Affordable new homes are defined as those priced under $200,000. These homes could be within reach for households earning less than $50,000 a year.
Since 2002, when new home data became available, the number of households increased by 20%, while the number of homes priced below $200,000 fell by 86%.
New households consist of young people with lower earnings. Homebuilders would profit off this group if they could.
Unfortunately, inflation pushed the price of homes up. This created a shortage of affordable housing.
Of course, the costs of building a home include more than lumber and construction supplies. Roads and utility connections account for part of the cost. There are also regulatory requirements.
This affects the entire housing market. Without a supply of new homes, existing homes become more expensive.
This is an example of hidden inflation. We can see the price of bread holding steady. But we can’t see home construction suffering from cost pressures without digging deeper.
Under the surface, there are many reasons to worry about inflation. Consider investing in an inflation hedge like gold.
P.S. To find out how you can use my “Strike Zone” Indicator to see gains of 364% in 12 days, 323% in 18 days, 496% in 4 days and more, sign up for this FREE broadcast.
- Michael Carr is a Chartered Market Technician for Banyan Hill Publishing and the Editor of One Trade, Peak Velocity Trader and Precision Profits. He teaches technical analysis and quantitative technical analysis at New York Institute of Finance. Mr. Carr is also the former editor of the CMT Association newsletter, Technically Speaking.
- Follow him on Twitter @MichaelCarrGuru.