
Weather forecasts — much like stock market forecasts— are notoriously inaccurate. We all remember the time we planned an outdoor activity and the weather ruined our plans. Often, in our memories, the weather forecast called for sun and warm temperatures. Instead, we had rain or wind.
But in part, the problem is our memories. We tend to focus on things that go wrong. We also focus on finding scapegoats to blame.
The truth is we’ve probably made plans for hundreds of days. And almost all the time, the weather cooperated. We forget the good days. We remember the day we left our umbrellas at home because the forecast was perfect — and wrong.
The reason bad forecasts stand out is because so many are accurate.
Government data shows that five-day forecasts are accurate 90% of the time. Seven-day forecasts accurately predict the weather about 80% of the time. But forecasts 10 days or more in the future are right only about 50% of the time.
Many stock market forecasts show similar trends.
Stock Market Forecasts More Accurate in Short-Term
Countless factors influence both the weather and the stock market. These factors interact with each other in predictable and unpredictable ways. In the very long run, the interactions are impossible to understand. But in the short-term, certain factors are more important than others, and reliable stock market forecasts are possible.
Last week, I noted a relatively rare technical signal was forecasting gains over the next five days. Since then the S&P 500 is up 3.1%. That’s well above the average one-week gain of 0.2%.
I also noted this signal tells us nothing about the trend one month from now. The truth is, short-term stock market market forecasts will be more accurate than long-term. The reason why is shown in the chart below.
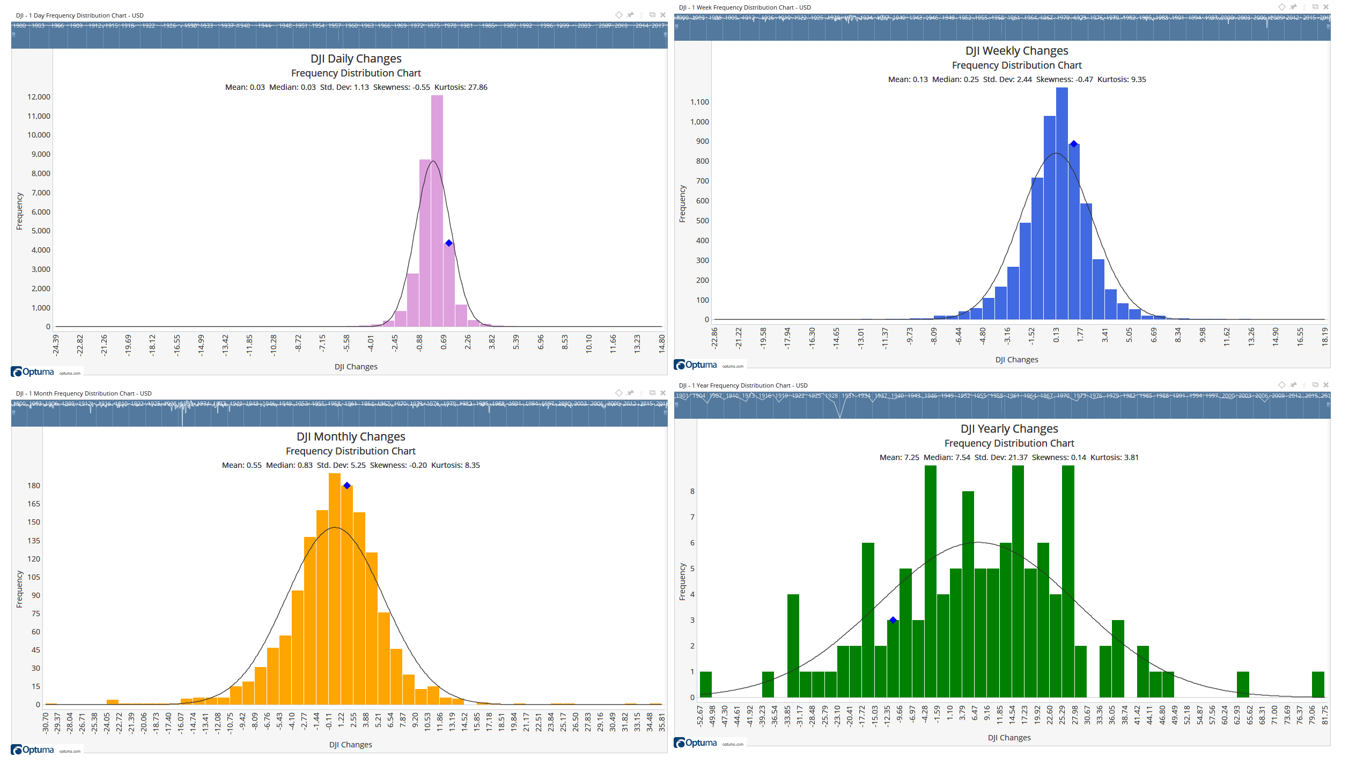
Source: Optuma
The chart shows the distribution of price changes over different time frames. This chart looks at the history of the Dow Jones Industrial Average since 1900.
In the upper left, daily changes are clustered close together. In the upper right, weekly changes show less clustering. Monthly changes, in the lower left, still show some sense of orderliness. But yearly changes, shown in the bottom right corner, are almost random.
The variability of returns increases as the time frame changes from daily to monthly. In technical terms, the standard deviations of price changes increase as the length of time increases.
Despite this, many investors insist on focusing on the long-term. They may be surprised to realize that just like the weather, short-term stock market forecasts are more predictable.
A note from Michael Carr: Because of their predictability, I focus on short-term trading. Next week, I’ll be sharing details on a strategy I’ve been trading for a local animal rescue. On average, trades are closed about two days after they’re opened so it does require some effort. But the results indicate the effort can be rewarded. I placed $10,000 in that account on January 1 and we made more than $7,600 in gains by May 31. To learn more, click here.
• Michael Carr is a Chartered Market Technician for Banyan Hill Publishing and the Editor of One Trade, Peak Velocity Trader and Precision Profits. He teaches technical analysis and quantitative technical analysis at New York Institute of Finance. Mr. Carr also is the former editor of the CMT Association newsletter Technically Speaking.
Follow him on Twitter @MichaelCarrGuru.