
When I first got into this business, I talked to as many older traders as I could find.
I knew experience was the best teacher — but I was in a hurry. I didn’t want to take time to encounter everything markets could throw at me.
By talking to old traders, I learned from those who had enjoyed long and successful careers.
They often had short, little thoughts that spoke volumes to me as a newcomer. One told me: “The most bullish thing a stock can do is not go down.”
That took me some time to understand. He was saying when a stock isn’t falling, it’s bullish. That sounds obvious, but it’s not. It’s a powerful rule to find useful chart patterns.
Below is a weekly chart of the iShares Russell 2000 ETF (NYSE: IWM). It shows that the price is about where it was in December 2020.
Small Caps Haven’t Moved Much Recently
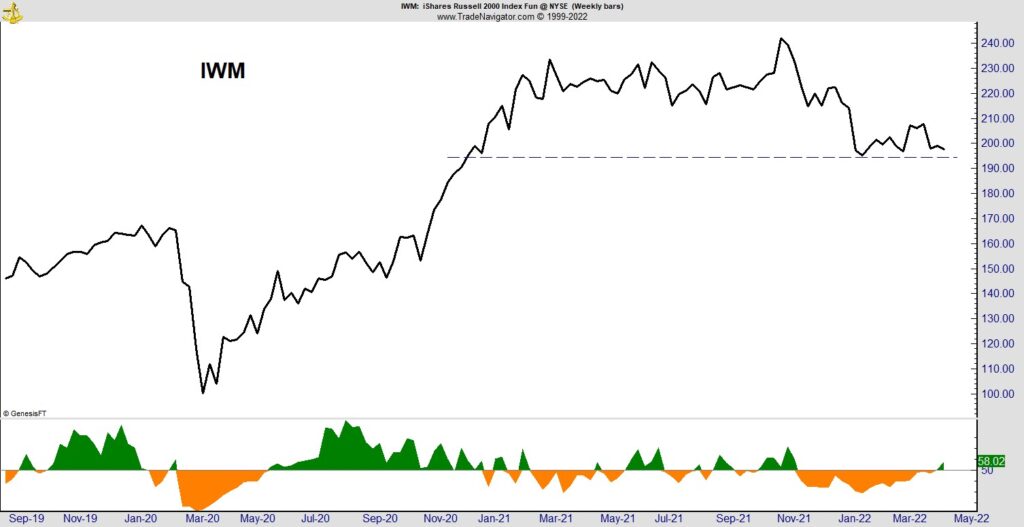
Over 16 months, IWM hasn’t gone below that level. For the that past three months, the price hasn’t made much progress up or down. That’s bullish.
Why Small Caps Look Bullish
In the simplest terms possible, price moves reflect the relative strength of bulls and bears. When bears are stronger, the price drops.
Despite selling pressure, buyers have prevented a drop in IWM.
I’m also bullish because momentum is turning bullish.
At the bottom of the chart is an indicator I created to measure the volatility of individual stocks. I focused on volatility because it rises when prices decline. It’s a great tool to confirm that a sell-off is underway.
This indicator transforms that insight into a timing tool that turns green when volatility is falling and prices should be due for a rally.
This indicator turned bullish last week. And it’s been improving as IWM trades near the current support level.
Bottom line: Based on this chart, we are likely to see small caps break out of their trading range. This could be an ideal time to buy.
Click here to join True Options Masters.