Government officials in Washington D.C. argue over anything — even the color of the sky.
So it’s significant when they do agree.
Right now, there’s consensus on one issue: Inflation is too high.
Inflation Hurts the Average Family
To understand inflation’s impact, we can measure it against the average family.
The Consumer Price Index (CPI) increased 8.6% in May 2022 from where it was at the same time last year. The Bureau of Labor Statistics reported that average wages grew 5.2% in that same time frame.
The difference between the two values shows how far families can fall behind.
We can use a similar process to determine how much inflation is in the economy.
Inflation Within the Economy
Gross domestic product (GDP) measures economic activity. Real GDP measures economic activity without factoring in inflation.
The difference between the two shows the amount of inflation within the economy. You can see that in the chart below.
Readings above zero signal inflation, and you can see it’s almost off the chart!
Inflation Is Sky-High
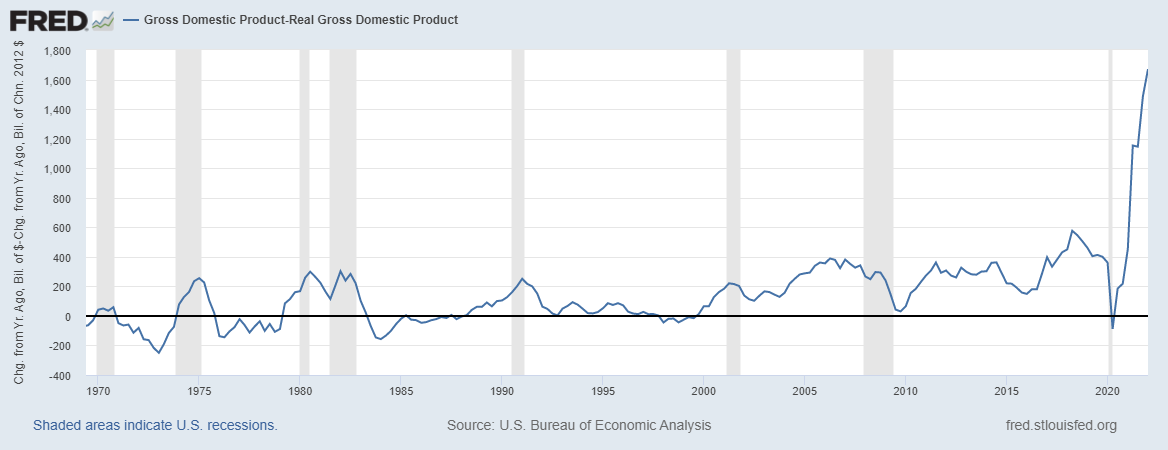
Source: Federal Reserve.
By this measure, there was $1.7 trillion worth of inflation in this latest reading. Since the pandemic ended, this measure shows a cumulative quarter-over-quarter value of $2.4 trillion.
In other words, there is $2.4 trillion more than the economy can use without generating inflation.
The government contributed to this problem.
The Stimulus Contribution
Total government stimulus spending adds up to about $4.6 trillion. The Federal Reserve created another $6 trillion in money through quantitative easing (QE).
We needed trillions of dollars, but we didn’t spend all of that $10 trillion in new money on the right things. Much of it contributed to inflation.
That is good news. As stimulus spending winds down, the Fed ends its easing programs. For example, higher interest rates force businesses and consumers to spend less.
Less money and less demand should lower inflation.
Bottom line: In the past, inflation appeared suddenly, as it has this time. It also fell just as suddenly.
With the government and the Fed out of the way, it’s possible the private sector can spend those trillions of extra dollars on productive projects.
P.S. Inflation and recession dominate headlines right now.
But investors are still looking for (and finding) ways to stay greedy — even as markets sink.
My new indicator finds ways to capitalize on this greed during the current down market. To find out how, click here to watch my “Greed Gauge Revealed” presentation now.
In this brand-new presentation, I show you how I use my latest indicator to watch every stock in the S&P 500 to see where investors are getting greedy at any moment.
It’s a strategy that has beaten the S&P 500 3-to-1 since 2000 through my extensive backtesting.
This system has found winning trades in 253 of the last 256 months even!
To find out how I’ll use my Greed Gauge to find more opportunities for you, click here to watch my new presentation now.
Michael Carr is the editor of True Options Masters, One Trade, Peak Velocity Trader and Precision Profits. He teaches technical analysis and quantitative technical analysis at the New York Institute of Finance. Follow him on Twitter @MichaelCarrGuru.