Since the 1960s, the capital asset pricing model (CAPM) became to investors what the Bible is to Christians…
It was an unquestionable “North Star” that tied everything in the belief system together. And it spent decades upholding its status as finance’s most sacrosanct law, embedding itself deeply into the minds of investors.
Regrettably, CAPM has now been wholly disproven. And it’s led investors like lemmings off a cliff alongside the high-risk stocks they thought would be “high expected return” investments.
See, the CAPM essentially says there is a positive linear relationship between a stock’s volatility and its expected future return. The more volatile the stock … the higher its expected future return.
Many investors have taken this to mean: “If you want to earn a higher return, you should invest in stocks with higher volatility.” Put more simply: “You’ve got to risk it to get the biscuit.”
Of course, shareholders of recently failed regional banks don’t have even a crumb of biscuit to show for the risk they assumed.
These stocks are certainly volatile. But one glance at a chart of the SPDR S&P Regional Bank ETF (NYSE: KRE) shows this was not a good sign for their future returns.
Meanwhile, my stock rating model alerted me to the undue risk well before their actual collapses. More on that in just a bit…
First, let’s have a look at the “low-volatility” factor, which exposes the CAPM and its “higher risk = higher return” fallacy.
On the Contrary…
Dozens of academic research studies demonstrate the market-beating premium investors can earn by investing in low-volatility — not high-volatility — stocks.
This directly contradicts CAPM. And evidence for this stretches back more than 90 years, so it’s no fleeting anomaly.
The chart below shows the compound return of low- and high-volatility portfolios from 1929 to 2020.
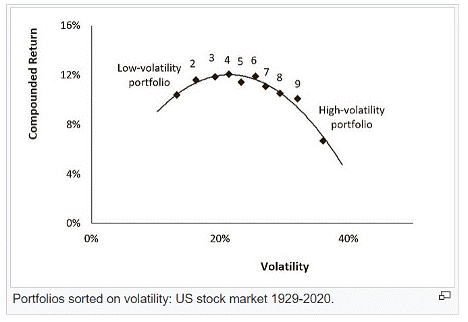
The existence of this counterintuitive relationship between volatility and expected returns has a number of explanations…
For one, most investors have an aversion to using leverage — which is when you borrow money to invest in a position larger than the cash you have on hand.
In absence of that aversion, it would be rational for an investor to build a portfolio of low-volatility stocks … then lever it up conservatively so that it matches the return of a higher-volatility portfolio.
But “leverage” is a dirty word to most folks. So, instead, investors who seek higher returns forego that option and simply invest in stocks with higher volatilities.
This phenomenon dovetails with another behavioral bias: the “lottery ticket” effect.
Human nature urges us to seek “moonshot” returns in highly volatile stocks, even if the odds of earning such returns are minuscule and lower than we estimate.
This bias works toward unjustly inflating the prices and valuations of high-volatility stocks while leaving low-volatility stocks underpriced.
Taken together, investors show a preference for high-volatility stocks … even though low-volatility stocks have delivered superior returns for those who are wise enough to pursue them.
Lastly, there’s a major hurdle that high-volatility stocks must overcome to a far greater degree than low-volatility stocks — the large gains a stock must mount after a drawdown to get back to breakeven.
Maybe you’ve seen this chart before…
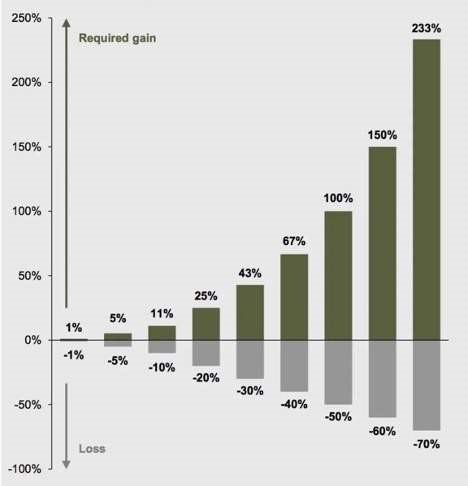
As you can see, when downside volatility hits a highly volatile stock … it requires a herculean rally just to get back to breakeven.
Low-volatility stocks tend to hold up better in down cycles, which sets them up for an easier road to recovery and, over time, allows for more efficient compounding of capital.
Longtime members of my Green Zone Fortunes newsletter know that my team and I consider a stock’s volatility before we recommend it. “Volatility” is one of the six factors my Green Zone Power Ratings model is built on.
We don’t always seek stocks with the absolute lowest volatility, but we most certainly avoid stocks with the highest volatilities … because that’s where this factor is most effective at boosting overall returns.
In many market environments, it pays to take on some additional volatility. Meaning, a stock that ranks in the middle of the pack on volatility may actually be worth the risk, and outperform some of the lowest-volatility stocks in the market.
But what you most definitely want to do is avoid the top 10% most-volatile stocks.
Countless academic papers, as well as my own research and stock rating model, show that this is where you find the stocks that lag the market the most and even generate negative returns.
We’re seeing a lot of high volatility today, which is what led me to write this essay. I want you to avoid confusing an alarming level of volatility with a bargain on a sector going through a rough patch.
Right now, there’s no better example than the ongoing woes of the regional banking sector…
How Volatility Helps to Safely Sidestep Regional Bank Failures
My lead analyst Matt Clark and I recently ran a study to prove my experience with the “sweet spot” of volatility…
We compiled a list of the individual stocks held in KRE and then categorized them into 10 “buckets,” based on the volatility score my stock rating model assigned to each one.
To be clear, we used my model’s ratings as of March 6, 2023 … the Monday before the banking crisis began with Silicon Valley Bank on Friday, March 10.
Through yesterday, here are the average returns of each of those 10 buckets of regional bank stocks:
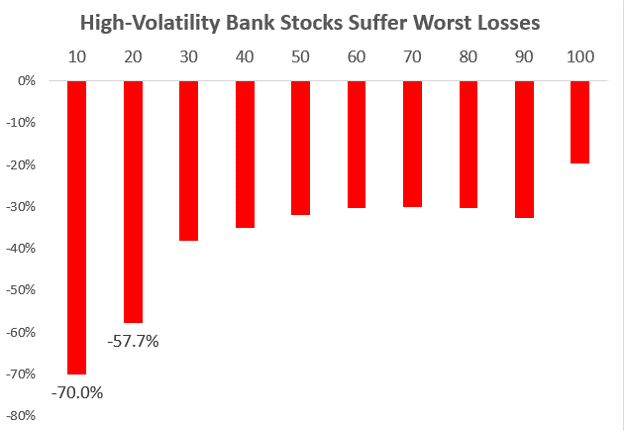
While the 80% of bank stocks with the lowest volatilities (the eight rightmost columns in chart) have still averaged a 31% drop since March 6, the 20% of bank stocks (two leftmost columns) with the highest volatilities have averaged a drop of more than twice that, at -64%.
More so, anyone who used my stock rating model to avoid the 20% of bank stocks with the highest volatilities could have avoided every single bank failure to date!
Silicon Valley Bank (SIVB) triggered my model’s highest “high-risk” volatility threshold (top 10% most volatile) on October 24, 2022 … when shares traded for $232. It later fell to $0.49, losing 99.8% of its value.
Signature Bank (SBNY) was flagged as a top 10% most volatile stock on November 21, 2022, when shares traded for $132. The stock later fell to $0.09 as the bank failed, leaving unsuspecting investors with a 99.9% loss.
Pacific Western Bank (PACW) was flagged on December 12, 2022, with shares at $24.83. As of yesterday, the stock was down more than 75%, to around $6. (For more on PACW, click here to read Matt’s Monday piece.)
And failed bank First Republic Bank (FRC) tripped my model’s “high-risk” volatility threshold on March 10 … the day SIVB went under. Shares of FRC were trading for $31.21 at the time, before falling 99% to under $0.50, when they were seized by regulators and sold in a fire sale to JPMorgan last week.
I’ve been eager to share this story of the unsung hero — the “low-volatility” factor — because there are so many investors who simply don’t know it exists.
And seeing how it alone could have helped you avoid the worst of the regional banking crisis — a crisis I believe is not yet over — I feel compelled to get the message out!
We all know that investing requires taking risk. But you don’t have to take undue risk, or risk for which you aren’t compensated … particularly if you’re still chasing the most highly-volatile stocks, thinking you’ve got to, you know, “risk it … to get the biscuit.”
The plain fact is, you don’t!
I’ve shown you today that a little volatility is a good thing.
If a stock hardly moves at all, you can’t expect it to move the needle on your wealth. If it moves too much … it’s probably sending the needle in the wrong direction.
My goal is simply to find stocks that move the needle in the right direction. And unlearning the disproven mantra of “high volatility, high returns” is essential to doing that.
To good profits,

Adam O’Dell
Chief Investment Strategist, Money & Markets
P.S. Speaking of moving your “wealth needle” in the right direction…
I recently spoke with my publisher to extend the sale on my research advisory that beat the Russell 2000 10-to-1 since inception — 10X Stocks.
One of the reasons being … wider market volatility has made some of my recent $5 stock recommendations even more attractive … and I want to give anyone on the fence the chance to learn more about them.
Another reason being … I genuinely could not be more bullish on these ideas.
They aren’t stocks you’ll find on the front page of CNBC or Yahoo Finance. But each of them is a critical part of a robust, inflation-proof, even recession-proof portfolio right now.
The fact that you can get into each of them for less than a fiver per share is just icing on the cake.
Go here to learn more about these stocks, and how you can get involved.