President Biden’s $1.9 trillion stimulus package is on its way to those in need and many who will save or invest their checks. This is the third stimulus package, and Washington has now allocated about $6 trillion in aid — almost one-fourth the size of the economy.
History shows large increases in money often lead to inflation.
To many economists, inflation is simply too much money chasing too few goods — this is a simplistic view of the problem, but it requires complex models to define whether there is too much money or too few goods. Whenever there are complex models, economists develop indicators to help them confirm the model’s output.
One of the indicators of inflation is the velocity of money.
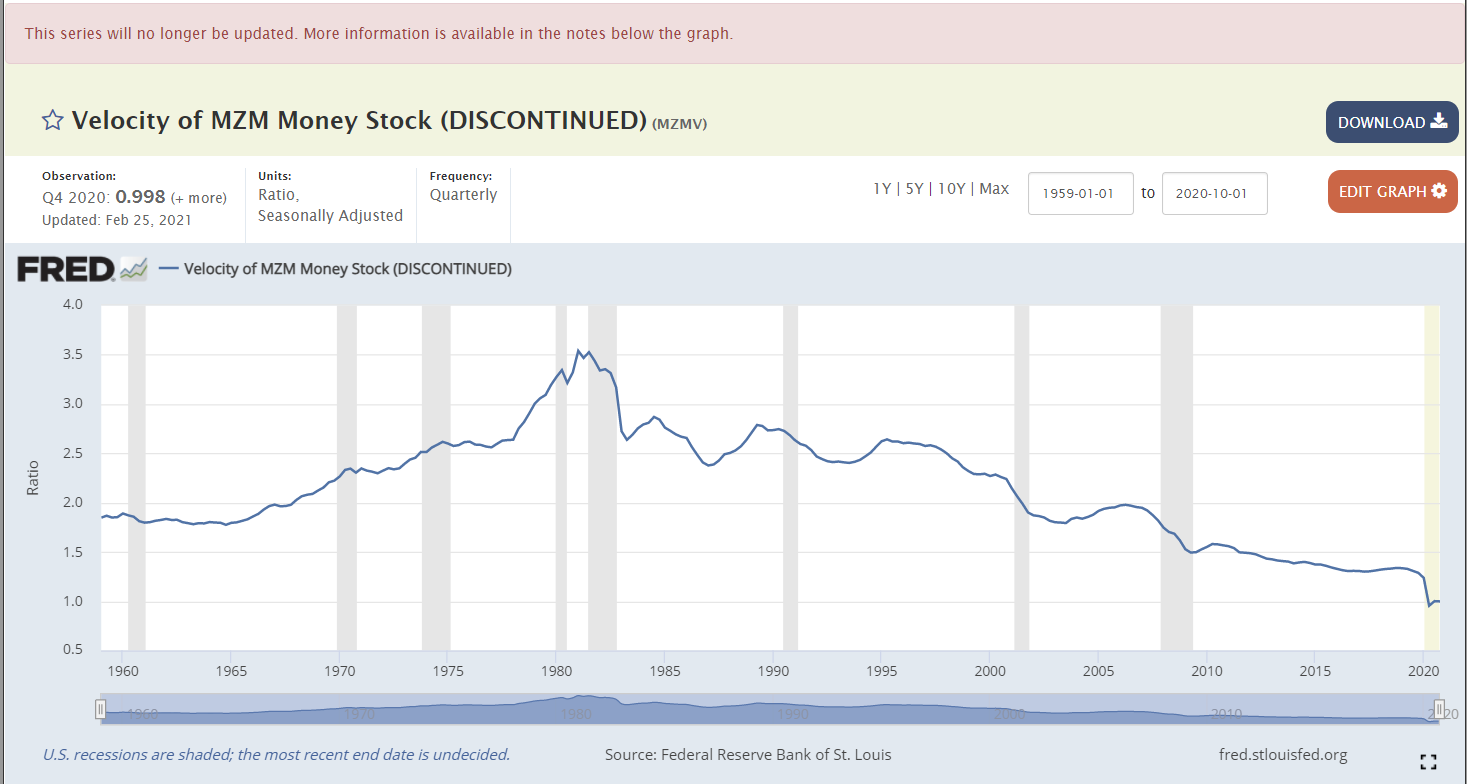
Velocity defines how fast money is spent. During inflationary periods, velocity rises as consumers race to spend money before it loses value. This can be seen in the chart below, which shows the velocity of MZM, the broadest measure of the money supply.
The Fed Discontinues MZM
Velocity and Inflation Spikes Are Still Measurable
Velocity spiked along with inflation in the 1970s, and both peaked in the early 1980s.
In the chart above, data on velocity dates back to 1959. In the last year, velocity fell to a record low. It looks like it bottomed at the end of last year, but we may never know for sure.
As noted in red at the top of the chart, the Fed discontinued this data series.
Conspiracy theorists might wonder why the Fed made that decision right as inflation seems ready to rise. Rational economists might wonder why the data would disappear when it’s most needed.
The Fed does discontinue data at times. However, the timing of this decision does leave much to be desired. We can use other data series to find similar information. But we’ll never know why the Fed decided to hide the original data from the public.
P.S. I’ve been telling my readers that someone could double their money in a year with this. By the end of 2020, I proved that to be true. My “One Trade” strategy has never had a losing year across 12 years of back testing. And last year’s live results were even better. Click here to see how it all works.
Michael Carr is a Chartered Market Technician for Banyan Hill Publishing and the Editor of One Trade, Peak Velocity Trader and Precision Profits. He teaches technical analysis and quantitative technical analysis at the New York Institute of Finance. Mr. Carr is also the former editor of the CMT Association newsletter, Technically Speaking.
Follow him on Twitter @MichaelCarrGuru.