According to a new paper on wealth inequality, the 400 richest Americans — the top 0.00025 percent of the population — have tripled their share of the nation’s wealth since the early 1980s and now own more of the country’s riches than the 150 million in the bottom 60 percent.
That bottom 60 percent saw their share of the nation’s wealth shrink from 5.7 percent of the country’s riches in 1987 to just 2.1 percent in 2014, according to the World Inequality Database.
Per the Washington Post:
Overall, Zucman finds that “U.S. wealth concentration seems to have returned to levels last seen during the Roaring Twenties.”
Wealth, here, is roughly synonymous with net worth: the value of everything that a family owns, minus the value of any debt. Assets such as homes, land, rental properties, stock holdings, business equity and bank accounts are included.
The definition excludes personal possessions like cars and furniture. They’re difficult to measure, don’t produce income and would amount to a tiny fraction of the nation’s net worth if they were included, according to Zucman.
For illustrative purposes, consider a person who owns a $250,000 house with $200,000 in outstanding mortgage debt. She also has $5,000 in her bank account and $25,000 in a 401(k). That person has a net worth of $80,000, a figure derived from the sum of all her assets ($250,000 + $5,000 + $25,000) minus the sum of all her debts ($200,000). That $80,000 puts her close to the national median of household net worth, according to previous research by Edward N. Wolff of New York University.
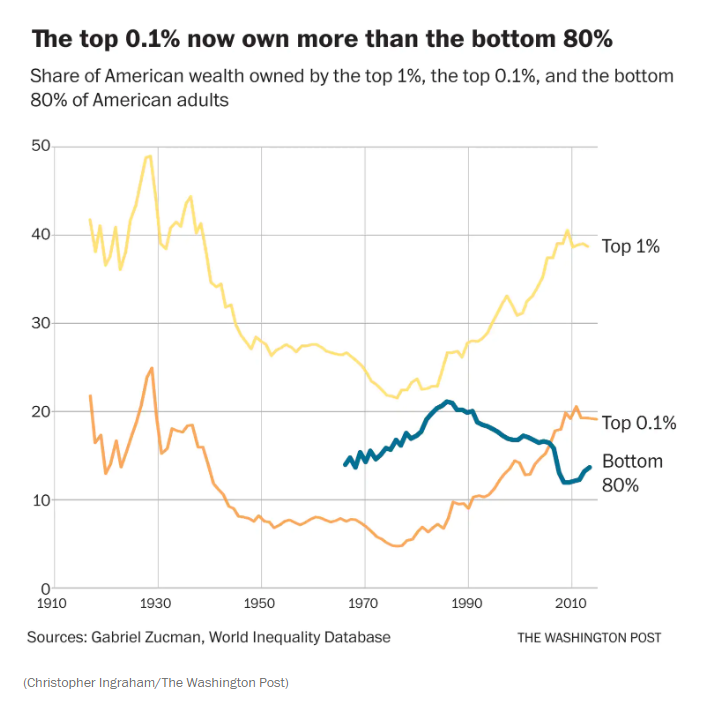
American wealth is highly unevenly distributed, much more so than income. According to Zucman’s latest calculations, today the top 0.1 percent of the population has captured nearly 20 percent of the nation’s wealth, giving them a greater slice of the American pie than the bottom 80 percent of the population combined. That bottom 80 percent figure includes the 1 in 5 American households that has either zero or negative wealth, meaning that its debts are greater than or equal to its assets. According to NYU’s Wolff, the share of U.S. households with zero or negative wealth has risen by roughly one-third since 1983, when it was 15.5 percent.
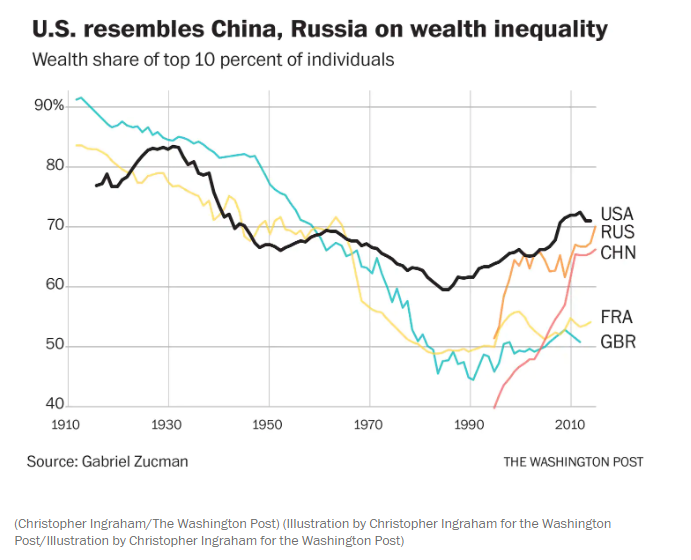
The top 10 percent of individuals, meanwhile, own more than 70 percent of the nation’s wealth, more than twice the amount owned by the bottom 90 percent. The top 10 percent have increased their share of wealth by about 10 percentage points since the early 1980s, with a concomitant decline in the share of wealth owned by everyone else. In some ways, Zucman finds, the distribution of wealth in the United States more closely resembles the situation in Russia and China than in other advanced democracies such as the United Kingdom and France.
Several caveats to this discussion are in order. First, a person with negative net worth is not necessarily penniless. A number of the households in the negative-net-worth bucket may be young professionals, like doctors or lawyers, starting off their careers with large amounts of student debt. This is not necessarily a problem if their high earnings ultimately erase their debt and catapult them into the upper reaches of the wealth spectrum later in their careers.
But young, high-earning professionals account for a minority of negative-net-worth families. The 2016 Survey of Consumer Finances, for instance, shows that about 40 percent of families in the bottom quartile of net worth had an outstanding student loan balance of any kind. High-earning professionals probably account for just a fraction of that 40 percent.
Second, rising wealth inequality may not necessarily be a zero-sum game: The rich gobbling up a larger share of the national wealth pie may not be a problem if there’s still more pie left for everyone else, relative to several years or decades ago. There’s good reason to suspect that this may be the case for income: While incomes at the top have risen dramatically over the past few decades, incomes in the middle have risen, too, albeit much more slowly.
But the same dynamic is not occurring with household wealth. According to Wolff, the median household wealth in the United States in 2016 ($78,100) was slightly lower, in inflation-adjusted dollars, than it was three decades ago in 1983 ($80,000). Over the same time period, the average wealth of the top 1 percent of households more than doubled, from $10.6 million to $26.4 million.
Look out rich people. The socialists are coming for your cash.