If the early-October low was the bottom, this has been a below-average bear market in length and depth.
As I shared with my Max Profit Alert readers several months ago, the average bear market since 1950 lasted 11 months from top to bottom. We are just shy of that mark in 2022.
As for depth, the typical bear market takes 30% off the S&P 500. The current bear market has the S&P 500 off its highs by 23%.
On both counts, this would be considered a relatively “mild” bear market if it just ended.
Of course, the “mild” label is based on a comparison to historical averages — which, given the wide range of historical outcomes around those averages … are practically useless in “calling the bottom.”
For instance…
There is a large degree of variability around that average length of 11 months.
The 2020 bear market lasted just over one month. You blinked, and it was over.
On the other hand, the 2000 to 2002 “dot-com bust” bear market lasted a full 30 months. It was two-and-a-half years of agony and wondering: “Are we there yet?!”
What’s more…
While the S&P 500’s average decline for all bear markets since 1950 is 29.8% … most folks here remember the 2008 financial crisis, and the dot-com bust, as “the mothers of all bear markets.” For more analysis on why these averages shouldn’t be taken at face value, check out my colleague Charles Sizemore’s piece from earlier this week.
The 2008 bear market knocked a full 56.8% off the S&P 500, while the early 2000s bear market put it down 49.1% — though the tech-heavy Nasdaq 100 Index lost a massive 83%!
All told, the variability around historical bear market averages means we need a real-time solution to “calling the bottom” — not a “forecasting” one.
And I have something that should help with that.
My “Panic-Selling” Signal
More important than the length and depth of the current bear market is the fact that there hasn’t been a palpable wave of fear-driven panic selling yet — which is in sharp contrast to the obvious panic we witnessed in the second half of the 2008 bear and the 2020 flash crash.
Let me show you what I mean with an indicator I’ve used for many years now…
The indicator takes a simple ratio of the number of declining stocks to advancing stocks on a given day. When the number is high — I look for a ratio of 8-to-1 or greater — it shows that investors are selling just about every stock at lower and lower prices. In short, it signals fear-driven panic selling.
This is by no-means a “magic bullet” indicator. It takes experience and nuance to use it.
What I mean by that is … the panic-selling signal often marks the end of a sell-off. However, during some stages of certain bear markets, a number of panic-selling signals can come in at close succession and at lower and lower prices.
That means you can’t just start buying stocks as soon as you see this signal for the first time.
The indicator is most useful at “calling a bottom” once you see a handful of signals in a short amount of time. In essence, the multiple signals show, to put it somewhat grotesquely, all investors have puked their brains out, and that marks the end of a major bear market in most cases.
Let me show you how this played out in 2020…
The 2020 Coronacrash
Here, you’ll see eight days of panic-selling signals (red dots) within 18 days:
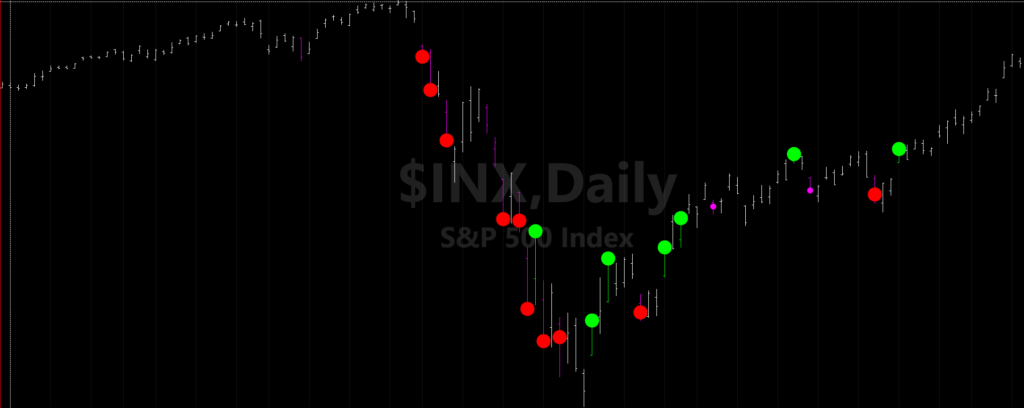
The first few signals didn’t mark the bottom, but the last few did … especially when they were followed by a succession of “kick-starter” days (green dots) when eight or more stocks advanced for every one that fell (i.e., the inverse of the panic-selling signal).
Long-time Max Profit Alert readers know I use these signals, since I wrote about them extensively during March 2020 as I speculated that the climax of the panic was resolving.
Of course, the 2020 bear market was atypical in that it was triggered by a global health crisis and also in that it lasted only a couple of months.
So let’s look at panic-selling signals during the 2008 bear market…
Panic Selling in the 2008 Financial Crisis
Here you’ll see just one panic-selling signal, in November 2007, during the first 11 months of the bear market.
And then … you’ll see a succession of 14 panic-selling signals during the seven months between September 2008 and March 2009:
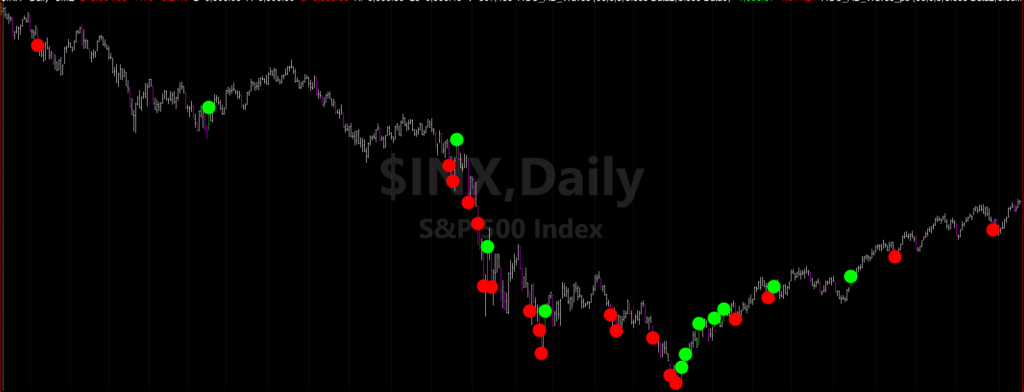
In short, the first two-thirds (measured in time) of the 2008 bear market was a slow, orderly and panic-free decline. The final third was fast, disorderly and marked by a wave of panic selling … whereby investors’ actions became increasingly fear-driven.
Once everyone had puked their brains out (March 2009) … and a wave of buying ensued (five “kick-starter” signals in March and April) … it became clear that the bear market had ended, and the road to recovery had begun.
The Current Bear Market
Here’s a chart of the S&P 500 since the start of the year:
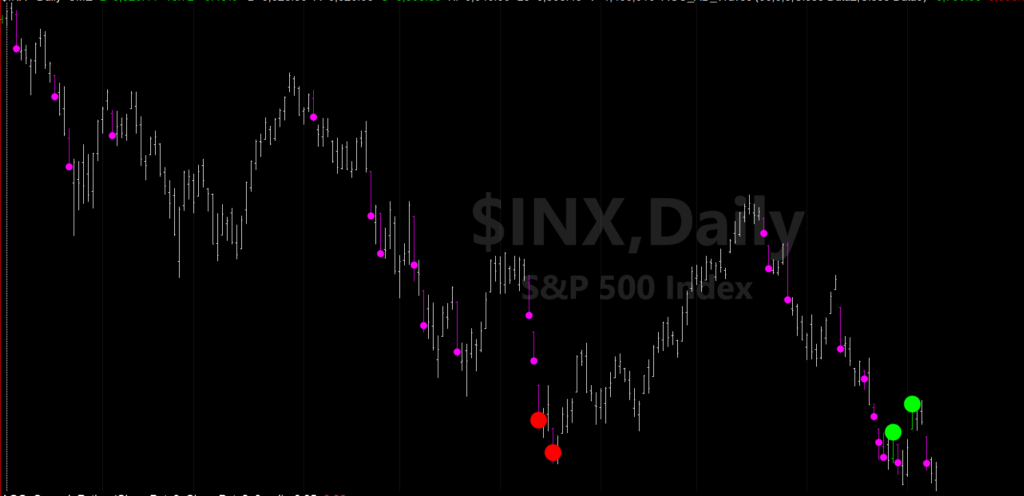
You’ll see just two panic-selling signals over four days … marking the mid-June lows.
Indeed, the market bottomed there. It then climbed 18% higher, as I shared above.
The problem is … that rally fizzled, and the market has since fallen to new, lower lows.
And even though we saw two “kick-starter” signals last week … that rally didn’t hold either. The new, lower lows came after that bullish signal — which is a worrisome sign.
So viewed through this lens of panic-selling signals…
We saw eight in 18 days during the fast and furious coronacrash…
We saw 14 in a seven-month period during the final stage of the 2008 financial crisis…
And yet we’ve seen just two panic-selling signals during the 10 months of this current bear market.
This can only mean one of two things:
A) The bottom is in, and we’ll view this bear market in hindsight as a “mild” one.
Or…
B) The bottom is not in, and the wave of fear-driven panic selling that marks the final stage of major bear markets is still to come.
Folks, I’d love to believe Scenario A is about to play out. But it’s far more prudent to plan for Scenario B.
To good profits,

Adam O’Dell
Chief Investment Strategist