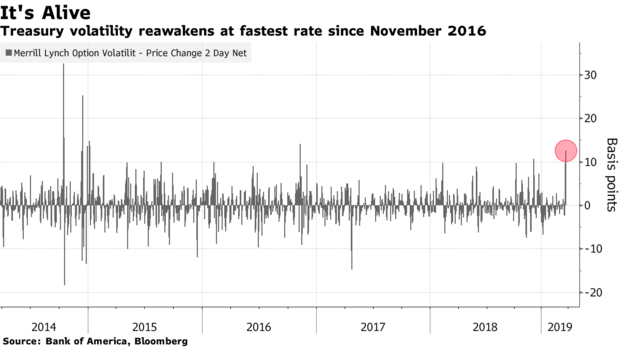
The calm in Treasury markets is over.
A measure of the U.S. rates volatility just saw its largest two-day surge since 2016 as the spread between short- and long-term borrowing costs — one of the four horsemen of the economic apocalypse and a recession indicator — intrudes upon the calmest rates market in a generation.
Per Bloomberg:
“The stability in U.S. rates over the previous three months has gone the way of the dodo,’’ BMO Capital Markets strategists Jon Hill, Ian Lyngen and Ben Jeffery wrote in a note.
As recently as last week, Bank of America Corp.’s MOVE Index, which tracks implied volatility in the $15.8 trillion Treasury market, had tumbled to a record low. Central banks have pressed the snooze button on cross-asset volatility lately by backing off borrowing cost increases while projecting a stable, low-rate environment.
But the Federal Reserve’s increased dovishness of late might have confirmed market fears of an economic slowdown.
Weak European economic data helped produce an inversion in the three-month, 10-year Treasury yield curve Friday for the first time since 2007. A race for government bonds sent the 10-year yield as low as 2.3754 percent on Monday — the lowest since December 2017.
“The deeper market pricing of inversion becomes, the stronger the rate-cut signal the market is projecting, and the higher the chances are this could turn into a contraction,” the strategists wrote.
Swings in other asset classes for the two sessions through Monday weren’t nearly as dramatic. The CBOE volatility measure of equities was fairly stable, as was the move by a JPMorgan currency gauge. The Fed’s policy announcement was on March 20.
“That the majority of the price action has been confined thus far to U.S. rates suggests that this is the market which is operating as the release valve for emerging macro pressure,’’ according to the BMO strategists.