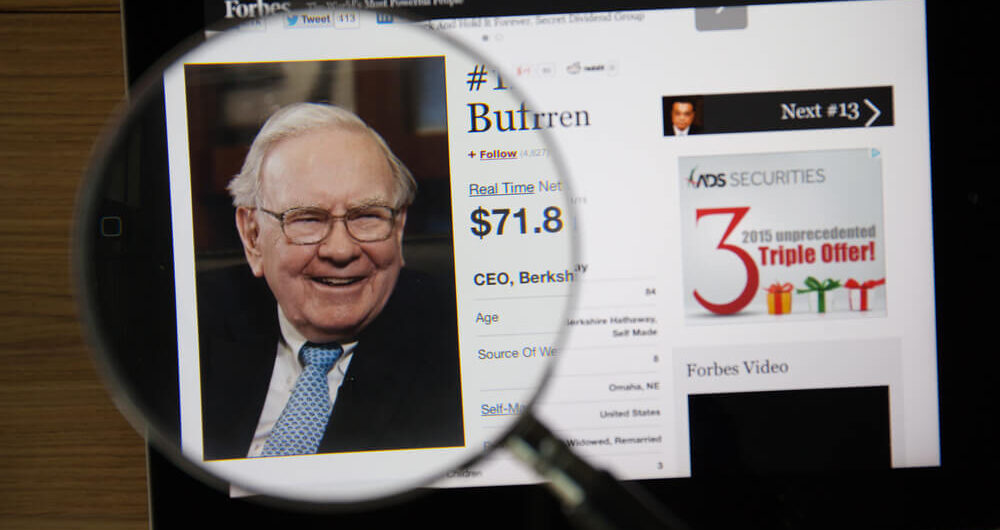
Warren Buffett is a man that needs no introduction. He’s arguably the greatest investor who ever lived. Or at the very least, he’s been consistently great for longer than any other living investor. As of Berkshire Hathaway’s last annual letter, Buffett generated cumulative returns of 2,744,062% between 1964 and 2019.
To put that in perspective, the S&P 500 returned 19,784% over the same stretch.
To say that Buffett crushed the market is an understatement. His compound annualized returns were double the S&P 500’s, at 20.3% vs. 10.0%.
So, when Buffett speaks, investors listen. And that extends to Buffett’s favorite macro indicator:
The Buffett Indicator is Now at All-Time Highs 📈https://t.co/diAzcx1sQW pic.twitter.com/48kdtT7H5Y
— Visual Capitalist (@VisualCap) February 17, 2021
Buffett is best known for largely ignoring “the market” and focusing instead on quality individual businesses. But he’s also done this long enough to know that most stocks follow the general direction of the market. So, macro still matters.
The Buffett Indicator
Buffett’s favorite macro indicator compares the market cap of the stock market to the size of U.S. GDP. In a nutshell, the Buffett Indicator compares the stock market to the economy. The main thesis is that economic growth fuels corporate profits. So stock prices cannot outpace economic growth forever.
Today, the market cap of the Wilshire 5000 index — one of the broadest measures of the entire U.S. stock market – is about 220% the size of the U.S. economy. In a vacuum, that doesn’t mean much. But it’s worth noting that at the peak of the late 1990s tech bubble — widely viewed as the most excessive market in history — the ratio “only” hit a little over 150%.
The trend has risen for decades as more of the economy has become “financialized.” The sub 50% levels we saw in the 1950s may not be relevant today. Visual Capitalist crunched the numbers and found that, given the long-term trend, a ratio of about 120% is “fairly valued.”
I wouldn’t get too caught up in the numbers here. This is not an exact science. Still, there is a wide gap between the “fairly” valued figure of 120% and today’s 220%.
The question becomes, what do we do with this information?
Is the Buffett Indicator a Warning to Sell?
It’s probably too early to sell and run for the hills. As we see in the historical data, the Buffett Indicator remained in the overvalued danger zone for most of the 1960s and the second half of the 1990s. In both cases, nasty bear markets eventually knocked the indicator back into undervalued territory. The 1968-1982 and 2000-2013 periods were lost years for most investors. But also, in both cases, had you sold as soon as the Buffett Indicator rose into the overvalued territory, you would have missed out on several years of solid gains.
So don’t sell just yet. But I recommend you stay sober. Keep your position sizes reasonable, and make sure your allocation makes sense at your age. If you’re retired or nearing retirement, you have no business having all of your savings in the market.
Buffett and Bitcoin
Meanwhile, the ever-quotable Buffett has been used to explain the recent action in Bitcoin and other cryptocurrencies:
Warren Buffett explaining the BTC phenomenon, way back in 1980:
“The rub has been that government has been exceptionally able in printing money and creating promises, but is unable to print gold or create oil.”
– Warren Buffett, 1980
Via @NuitSeraCalme
— Luke Gromen (@LukeGromen) February 14, 2021
Obviously, no one had ever heard of Bitcoin in the 1980s. But a lot of the rationale for the bull market in cryptocurrencies is the same as the rationale for the bull market in gold and commodities in the 1970s. The Federal Reserve is printing new dollars faster than they can be spent, and that excess liquidity is finding its way into stocks, cryptocurrencies and virtually every other asset class under the sun.
This is another reason that, while we should take the Buffett Indicator under advisement, we shouldn’t be too quick to sell everything. The market bubble may still have a few years left to inflate.
To safe profits,

Charles Sizemore is the editor of Green Zone Fortunes and specializes in income and retirement topics. Charles is a regular on The Bull & The Bear podcast. He is also a frequent guest on CNBC, Bloomberg and Fox Business.


