
Buying an exchange-traded fund (ETF) can be a great way to gain diversified exposure to a specific sector, industry group or investment “theme.” You can buy a whole basket of individual stocks with just one click of the mouse (or tap of the finger).
But the diversification we get with an ETF doesn’t get us off the hook — as informed investors, we should look under the hood at the fund’s individual stock holdings.
Have a look at this chart:
How One Stock Can Affect an ETF’s Performance
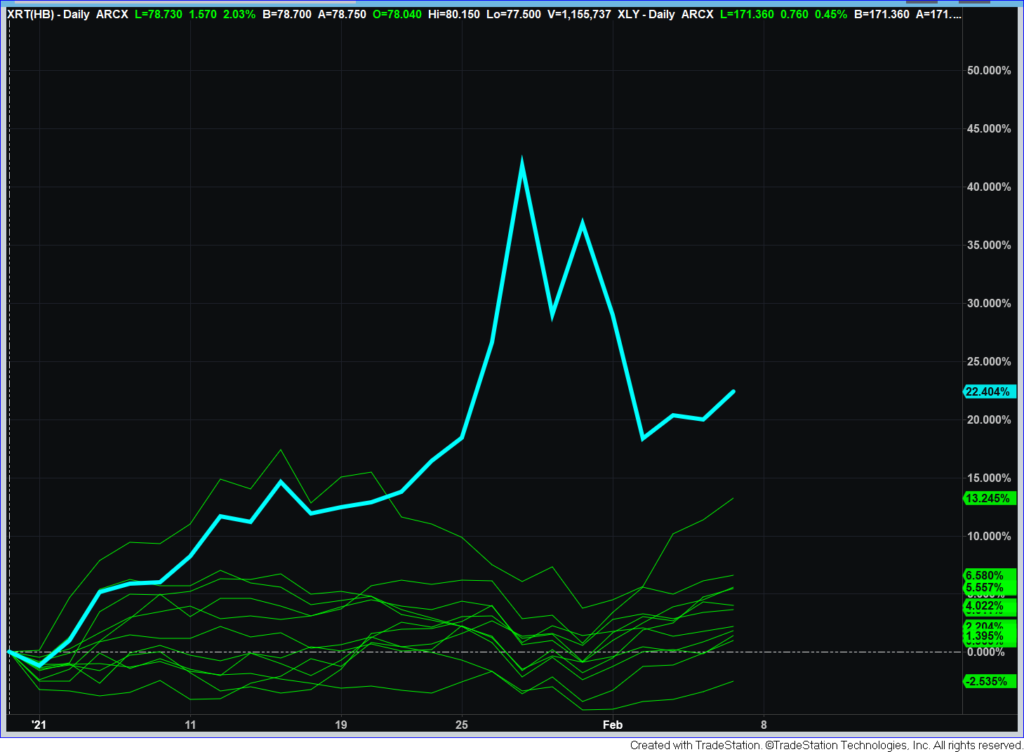
It plots the year-to-date returns of the 11 sector ETFs I track in my Home Run Profits and 10X Profits services, plus the one industry group ETF that’s gained the most so far this year (in blue).
Can you guess what that industry ETF is?
It’s retail.
And that dramatic spike you see in its recent performance … that happened because the SPDR S&P Retail ETF (NYSE: XRT) owned shares of GameStop Corp. (NYSE: GME) as one of its top holdings.
Today, I want to dig into two “retail” ETFs:
- The SPDR S&P Retail ETF (XRT).
- And the iShares U.S. Consumer Goods ETF (NYSE: IYK).
Let’s see which is the better buy …
What Does our Green Zone Ratings System Say About These ETFs?
I’ve shared before (here and here) how you can use my Green Zone Stock Rating System to “x-ray” an ETF and its individual stock holdings.
This gives us an idea of how well the ETF’s stocks rank overall, and on each of the six factors the model scores. It also helps us identify an ETF’s top-ranked stocks … for those of us who’d rather make targeted plays on individual stocks instead of buying the whole fund.
Here’s a summary table of the Green Zone Ratings for XRT and IYK:

Green Zone Ratings on February 9, 2021.
As you can see, XRT scores better on three of the six factors: momentum, size and value.
This means that, relative to IYK, the individual stocks held in XRT are in stronger uptrends (momentum) … they’re smaller companies (size) … and their valuations are more attractive, aka “cheaper” (value).
On the other hand, the individual stocks held in IYK are superior on the other three factors: volatility, quality and growth.
This means that, relative to XRT, the stocks held in IYK are less volatile (volatility) … have higher-quality fundamental metrics, such as profit margins, returns on equity and debt-to-equity ratios (quality) … and are growing sales and earnings at a higher rate (growth).
So, which is the better buy?
Frankly, it’s a “toss-up” to me. That is, based purely on these Green Zone factor ratings.
XRT earns an overall score of 63.6. That’s better than average, but only a small margin above IYK’s overall score of 57.8.
But let me share this wildcard with you …
IYK’s Big Bet on Tesla
Right now, the largest holding in the XRT ETF is GameStop, though the stock represents a reasonably small 3.6% of the fund’s total assets.
On the other hand, the largest holding in the IYK ETF is Tesla Inc. (Nasdaq: TSLA) … and its Tesla position is a whopping 20.1% of assets!
That’s a huge, “overweight” bet on one specific stock, especially for an ETF that promises to give investors diversified exposure to an industry group.
Now, you may love TSLA … and maybe you’ll still want to buy shares of IYK after reading this analysis. That’s totally fine. It’s your choice to make.
I just think anyone who buys shares of the iShares U.S. Consumer Goods ETF (IYK) should be eyes-wide-open aware: You’re making a big bet on Tesla, more so than getting diversified exposure to the retail industry.
Tesla’s performance will drive this ETF’s performance, for better or for worse.
And that’s the other thing …
I’m not certain for how long the IYK ETF has held 20% of its assets in Tesla shares, but, based on the fund’s performance over the past two years, I highly doubt it has had a substantial stake in Tesla during the stock’s massive 1,200%-plus run-up.
Have a look at this chart, which plots the performance of XRT (blue) and IYK (green) together and Tesla (yellow) below over the last two years:
IYK Missed TSLA’s Huge Run Up
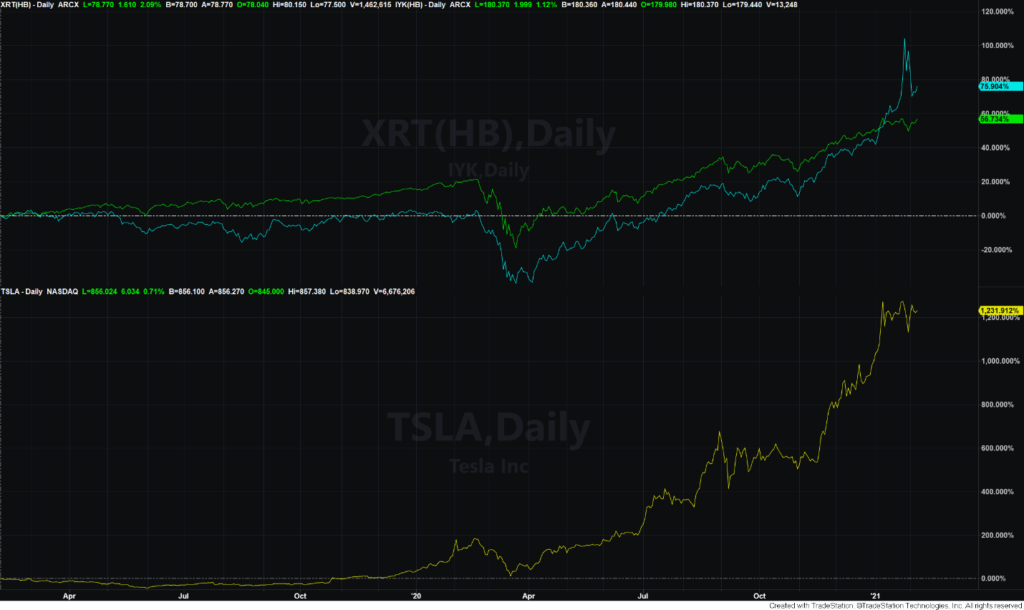
Shares of XRT were up around 76% in early February, while shares of IYK gained only 56%. Meanwhile, TSLA is up more than 1,200%!
My point is … had IYK owned a 20% stake in TSLA during the stock’s run-up, it surely would have done better than 56% and beaten the pants off XRT.
But it didn’t.
And that brings me to my last point: I suspect managers of the IYK ETF have only recently given TSLA shares such a large allocation of the fund’s assets. And if that’s the case, they’re essentially chasing the performance of last year’s hottest stock … something a so-called “diversified” industry-group ETF is not supposed to do!
That puts IYK in my “buyer beware” bucket.
And it means the SPDR S&P Retail ETF (NYSE: XRT) is a “better buy” for anyone seeking truly diversified exposure to this industry group.
To good profits,

Adam O’Dell
Chief Investment Strategist
Adam O’Dell is the chief investment strategist of Money & Markets and has held the title of Chartered Market Technician for nearly a decade. He is the editor of Green Zone Fortunes, the trend and momentum options-trading powerhouse Home Run Profits and the time-tested switch system 10X Profits.
P.S. One caveat: There is an individual stock in IYK that rates 91 overall within my system, and my Green Zone Fortunes readers recently locked in a 100% profit on it in less than two months. I think the stock’s rally is just getting started … and I’d love to share the details with you. Check out my Millionaire Master Class here for more details.