As investors, we rely on indicators to help us make sense of market conditions. Simple indicators like the price-to-earnings (P/E) ratio help define value. Technical indicators like moving averages define the direction of the trend.
In the long run, disciplined investors can make money with their indicators. P/E ratios signaled the stock market was extremely overvalued earlier this year. Moving averages warned of the bear market as it began in February.
Not surprisingly, economists also use indicators to help them make forecasts. Their indicators are more sophisticated.
Fed Revises Failed FSI After Market Meltdown
One example is the St. Louis Fed’s Financial Stress Index (FSI). The Federal Reserve explains that FSI “is calculated using principal component analysis (PCA), which is a statistical method of extracting a small number of factors responsible for the co-movement of a larger group of variables.
Specifically, the STLFSI is the first principal component of 18 distinct measures of financial stress and is thus a measure of overall financial market stress.”
It’s difficult to calculate but simple to interpret.
Values above 0 indicate higher-than-average levels of stress, and values below 0 indicate lower-than-average levels of stress. FSI should have been above 0 in February.
The chart below shows the indicator through March 13.
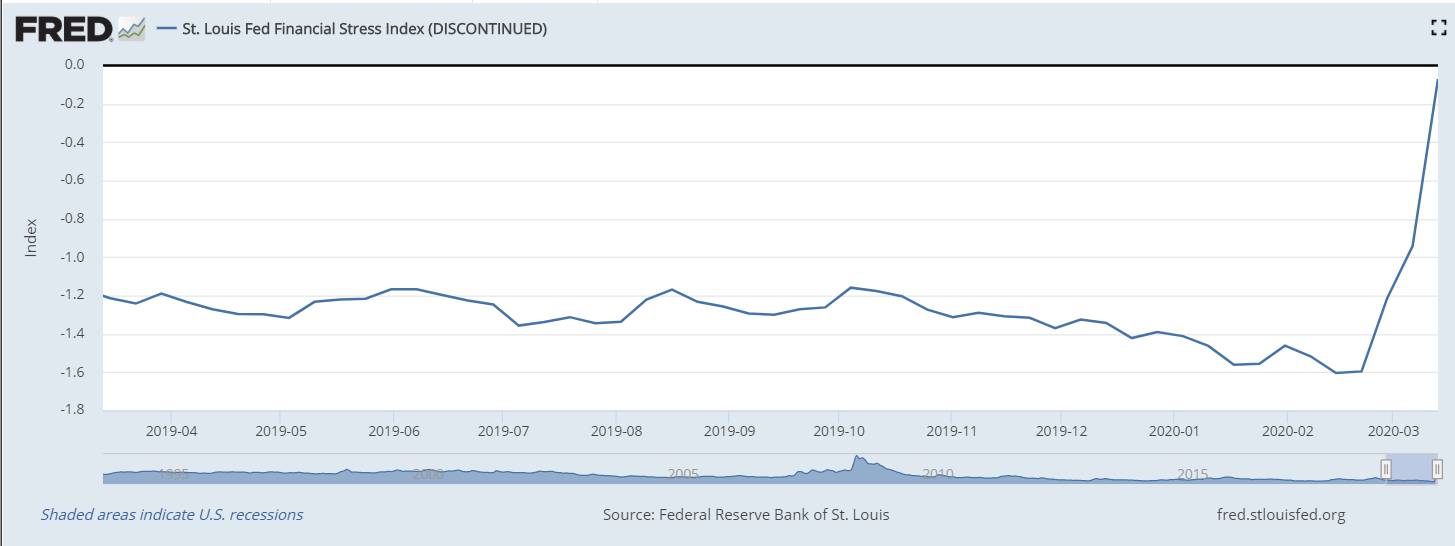
Source: Federal Reserve
Stock markets began melting down Feb. 24 when the FSI was at -1.6. That was the lowest reading on record. It signaled no stress in the market.
By March 13, the S&P 500 Index had fallen 25% and the Fed had cut short-term interest rates to zero. FSI was at -0.07, almost ready to signal the markets were under stress.
Economists at the Fed noticed the dismal failure of their index. They introduced FSI 2.0 on March 20. The new and improved indicator signaled market stress on Feb. 28, a timely signal in hindsight.
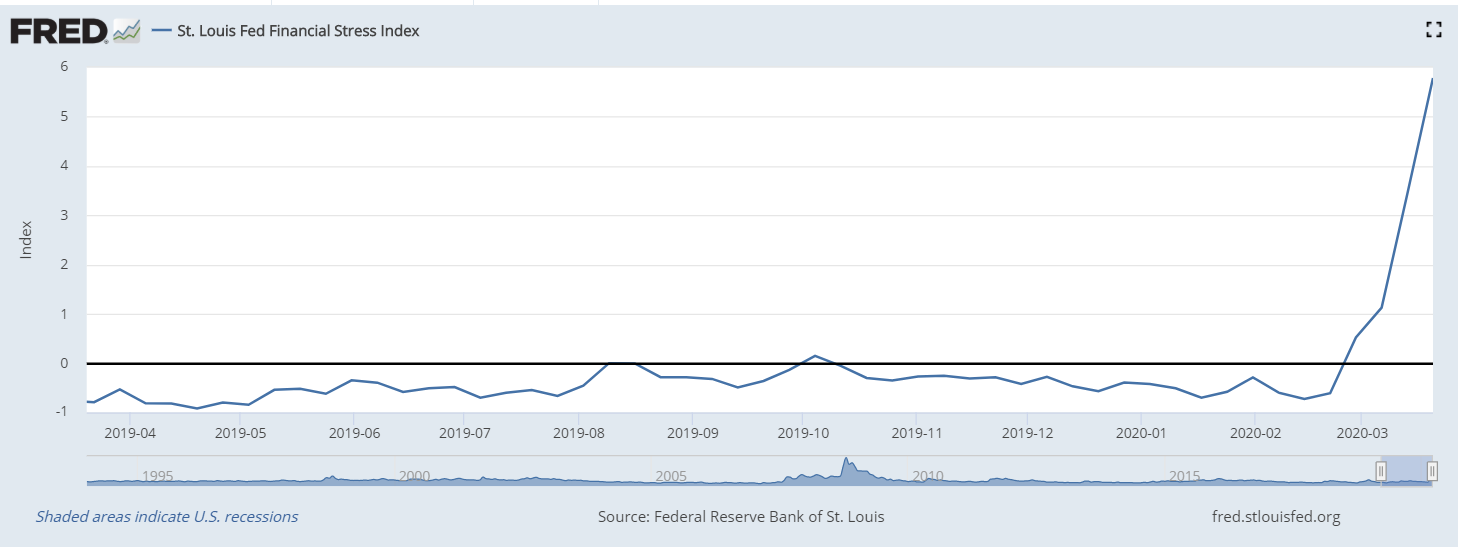
Source: Federal Reserve
Some question whether or not economics is a practical field of study. Tools like FSI move from theory to practice by helping economists identify problems before they develop.
But FSI didn’t work in real time. After the indicator completely missed the market’s meltdown, the Fed’s response was to revise the tool.
It was a timely response but not very effective.
More than 3.3 million Americans filed claims for unemployment insurance and stock market investors lost trillions of dollars. Meanwhile, policymakers were looking for a formula that would have identified the problem in advance.
In this case, it’s reasonable to say the Fed’s economists failed.
• Michael Carr is a Chartered Market Technician for Banyan Hill Publishing and the editor of Peak Velocity Trader and Precision Profits. He teaches technical analysis and quantitative technical analysis at New York Institute of Finance. Michael also is the former editor of the CMT Association newsletter Technically Speaking.
Follow him on Twitter @MichaelCarrGuru