

Every president’s first 100 days are always watched closely…
The premise makes some sense.
You just got elected, and the tailwind of that election is blowing at your back, giving you the moxie to enact your vision for the country quickly.
One example was in 1933.
Franklin D. Roosevelt was just sworn into office, and within the first 100 days, Congress passed 15 major bills and 77 different laws aimed at reversing the effects of the Great Depression.
Roosevelt also signed 99 executive orders in those first 100 days.
Zooming out, those first three months of a presidency can give the American public some insight into how they will enact their will over the next four years.
To be fair, the first 100 days are not indicative of the overall success of a president’s total term. We’re talking about 100 days of a 1,460-day term…
As I mentioned last week, it’s clear that investors don’t like the uncertainty of this new trade war. The so-called market “Trump Bump” has been erased amid new tariffs.
We haven’t hit 100 days yet, but is this the worst stock market start for a recent president?
Let’s see what this week’s charts say…
Chart of the Week: The First 50 Days Since 1953
Since 1953, 12 different U.S. presidents have served 19 different 4-year terms.
With President Donald Trump completing his first 50 days in office of his second term, we can look back and see how each of the major indexes has performed since Dwight D. Eisenhower’s first term:
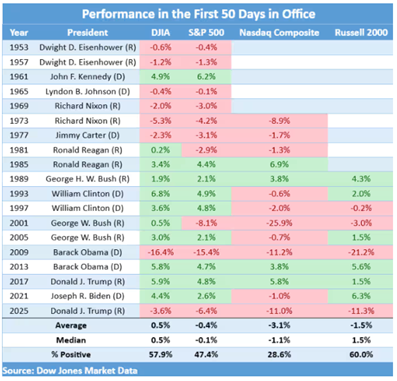
The recent market drop pushed all four major indexes down in Trump’s first 50 days in office … the worst performance since 2009 when Barack Obama entered his first term.
In Obama’s first term … every major index was down double-digits as the country continued to reel from the financial crisis that began in 2007. The small-cap Russell 2000 tanked more than 21% in 50 days!
Looking at other terms…
While the market was strong for much of the 80s and 90s, it struggled in the first 50 days under Eisenhower, Lyndon B. Johnson, Richard Nixon and Jimmy Carter — spanning both Republican and Democrat administrations.
Notably, the Dow is the only major index with a positive average (a slight 0.5% gain) in the first 50 days of all presidencies dating back to 1953.
You can see that it’s not uncommon to experience market drops as a president gets their legs under them in the first 50 days in office.
Bringing it back to the current market, it’s clear that this is not a repeat of President Trump’s first term.
What’s going on?
Comparing Trump’s First and Second Terms
In 2017, as Trump was in his first term in office, the market responded strongly. The S&P 500 was up 4.8%, and the Dow was almost 6% higher in the first 50 days of Trump’s first stint in the White House.
It was a different time then.
The economy was trucking along, coming out of the financial crisis stronger than ever.
In 2025, however, market volatility and economic uncertainty have rattled Wall Street.
The green line on the chart above shows how the S&P 500 climbed higher in the first 50 days of Trump’s first administration — up 4.8%.
The orange line shows how the market has performed in the first 50 days of the current term — down 6.2%.
As I mentioned earlier, it’s essential to understand a few things:
- This isn’t the worst the market has performed in a president’s first 50 days.
- The first 50 days of market performance are not indicative of future results (remember, stocks went on a tear from 2017 to 2020 before taking a nosedive thanks to the COVID pandemic).
The bottom line is that you have to be active and adaptive in these kinds of market conditions.
Understand that there is volatility and have a plan to deal with it.
Have a great rest of your week.
Safe trading,

Matt Clark, CMSA®
Chief Research Analyst, Money & Markets