“How much house can I afford?” This the most important question in the real estate market. Every potential buyer wants to know how much they can afford before they start looking at homes.
Before 2000, the answer was easy. Real estate agents and mortgage brokers told clients they could generally afford a house that sold for four times as much as their household income.
This relationship was surprisingly steady over time. The red line in the chart below is the median sales price of houses. The blue line is the median household income multiplied by four.
Home Prices Are Rising Above Family Income
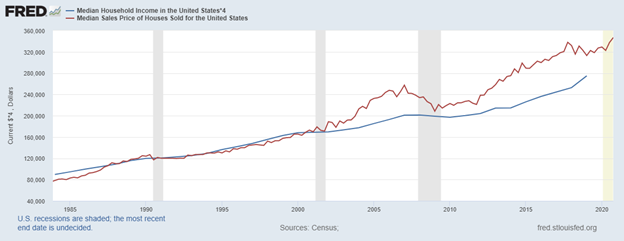
Source: Federal Reserve.
Median Home Price Outpaces Median Income Growth
The median is the midpoint, so half of homes cost more than that value, and half cost less. Medians are the best measure of the average tendency for data with large extremes, like home prices or income.
Since 2000, as interest rates dropped, families were able to spend more on mortgage payments. The next chart adds the amount of disposable income spent on mortgages (green line) to the chart and explains how home prices were able to increase so much in the past 20 years. All three are set to start at 100 in 1984, so changes in each are comparable.
Disposable Income Spent on Mortgages
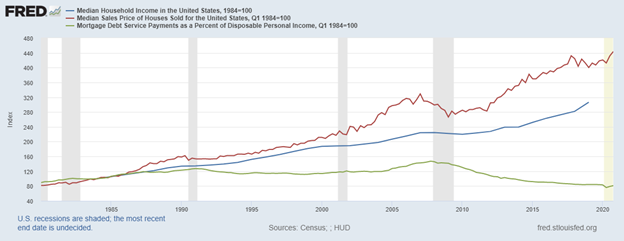
Source: Federal Reserve.
As Mortgage Interest Rises, Home Prices May Stutter
Before 2000, average families spent about 5.5% of their disposable income on mortgages. That increased to more than 7.2% in the housing bubble. As the Federal Reserve pushed interest rates towards zero, families were able to spend less on mortgages. That value bottomed at 3.7% early last year.
In the chart above, as rates rise, the green line will rise. If rates rise faster than incomes, families won’t have as much money to spend on homes. This means home prices can’t continue going up at this rate when rates rise.
The rapid rise in home prices since 2008 is unsustainable. While this might be an ideal time to sell a home, buyers could see values decline in the next few years.
Is this stupid … or brilliant?
I found a way to trade the markets making the same trade every week.
We do this because any given week, this trade can knock it out of the freaking park.
I recommended 59 of these trades last year. We saw five trades go up 100% or more — each in a week or less.
And a total of 18 went up 50% or more — in an average of two days each.
All told, someone could have doubled every dollar they invested last year trading this way.
I want to give you the same chance.
P.S. I’ve been telling my readers that someone could double their money in a year with this. By the end of 2020, I proved that to be true. My “One Trade” strategy has never had a losing year across 12 years of back testing. And last year’s live results were even better. Click here to see how it all works.
Michael Carr is a Chartered Market Technician for Banyan Hill Publishing and the Editor of One Trade, Peak Velocity Trader and Precision Profits. He teaches technical analysis and quantitative technical analysis at the New York Institute of Finance. Mr. Carr is also the former editor of the CMT Association newsletter, Technically Speaking.
Follow him on Twitter @MichaelCarrGuru.