
Financial panics and sudden crises were common in the 1800s. Banks failed, businesses went bankrupt, families lost farms… Recessions, and even depressions, followed.
There were at least eight panics in the 19th century. Some were caused by war. Others by politics. A few were caused by a lack of money.
For most of that time, the dollar was tied to gold or silver. This limited the amount of money in circulation. A limited supply of dollars contributed to panics in the fall of 1857, 1869 and 1873.
How Money Flows Affected 3 Crises
In 1857, the Ohio Life Insurance and Trust Company went bankrupt. Bankers had teamed up with railroad owners to fund speculative land deals. When profits failed to materialize, the mortgages went into default. The banking system couldn’t keep up with demand for money. The young nation’s economy collapsed. Corn prices fell 75%, bankrupting many family farms.
In 1869, speculators including President Grant’s brother-in-law, tried to profit in the gold market. When Grant found out about the plan, he ordered the Treasury Secretary to sell millions of ounces of gold. This led to a crash in gold prices. The speculators were left with losses. But the panic spread to stocks and banks throughout the country. Corn prices fell by 33%, again hurting farmers.
In 1873, speculators were again at work. Railroads were at the center of another buying frenzy. When money became scarce that fall, some borrowers couldn’t service their debts. This caused banks to fail. Once again, the country was in a financial crisis. Grain prices fell more than 50%.
The flow of money played a role in all of these crises.
In the 1800s, money flows were physical. In the autumn, farmers harvest grain. Eastern banks moved money to the Midwest. This made it available to buy grain. Farmers kept some of the cash and sent much of it back to their bankers to repay loans. That cash quickly found its way back East.
For the short time when money was in transit, Wall Street had access to less cash than normal. If a large firm found itself in trouble, there might not be enough money available for a bailout. This happened over and over again. Autumn panics and bank failures were an all-too-common event.
The Peril of Autumn for the Market Today
In theory, that shouldn’t be a problem today. We spend money without ever handling cash. Money is electronic. But autumn panics are still a part of the financial landscape.
My colleague Adam O’Dell hinted at this yesterday, and the chart below shows that September is an unusually perilous time for the SPDR S&P 500 ETF Trust (NYSE: SPY). The black line in the chart shows the price action of SPY. The blue line is the seasonal trend of SPY.
The S&P 500’s September Trend
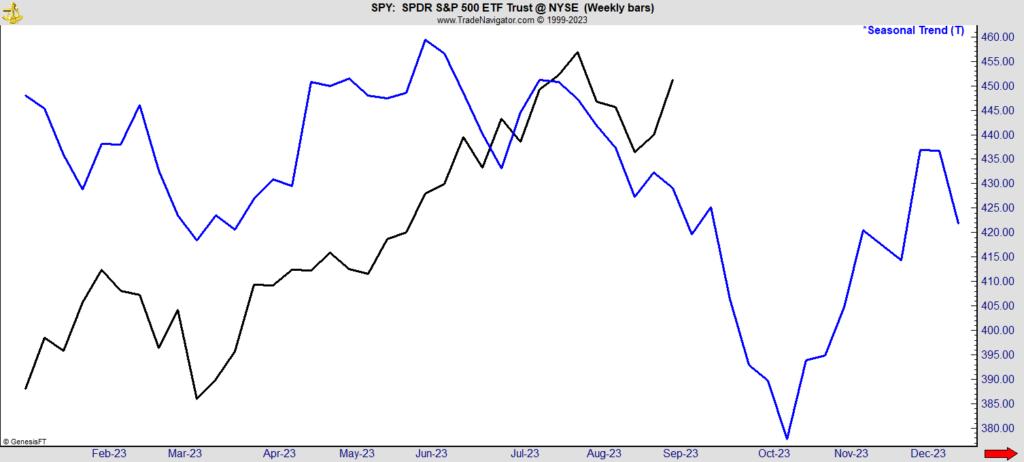
Average gains for each day are used to calculate that seasonality. These values are combined to draw the line. Seasonal trends show the expected direction of the price move. They don’t provide precise price forecasts.
For most of this year, SPY has moved in line with its seasonal trend. Prices were stronger than expected in May and June. The peak came a few weeks later than expected in July. But generally, seasonals forecast the trend.
The important part of the chart is the next few weeks. SPY is entering the most bearish part of the seasonal trend.
From now until early October, the trend is clearly down. Over the past 30 years, SPY declined 53% of the time. The average loss was 5%. The largest was 23%.
Buying in early October and holding for six weeks resulted in a gain 73% of the time. The average gain was 5.7%. The largest was 18%.
Now, seasonals aren’t a standalone trading tool. They are a valuable input into a trading strategy.
We now face seasonal headwinds. We should take any sell signals that are triggered this month as October will be a time to be aggressive on buy signals.
Until next time,

Mike Carr
Senior Technical Analyst