Inflation since World War II has been fairly constrained. It moved above 5% just a few times.
Each of those bouts of high inflation could be traced to an important event that explained why prices rose.
Inflation Tracks to Major World Events
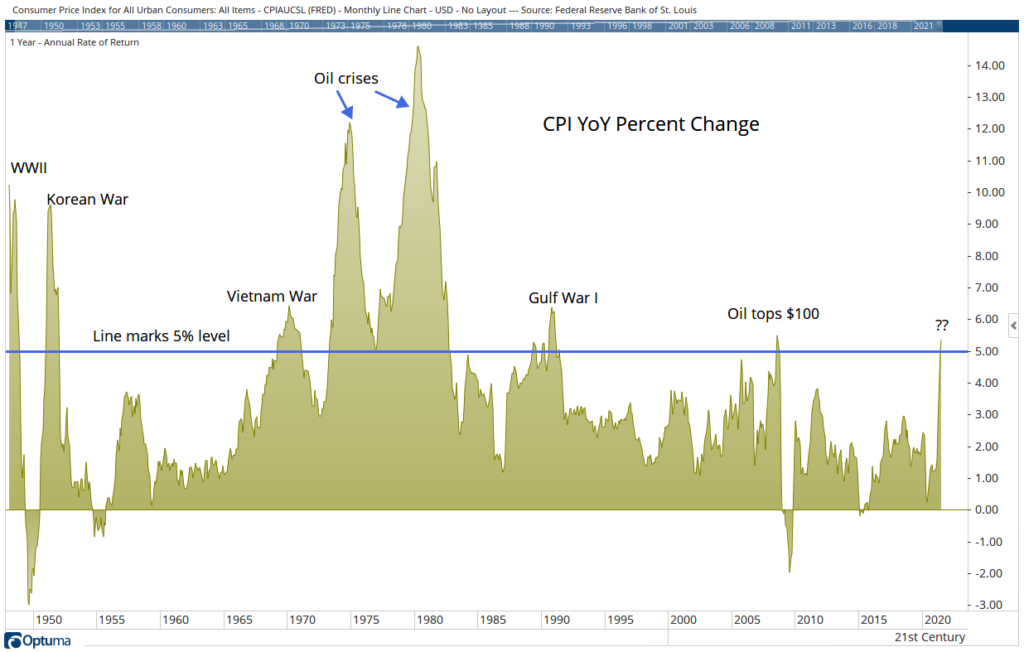
Source: Optuma.
A Series of Crises Led to Inflation
In the 1940s, ‘50s and ’60s, wars caused inflation. Standard economic theory explained this.
At the time, government spending was constrained. War forced governments to spend large amounts of money quickly. For centuries, wars could be won or lost based on how effectively a government ramped up spending.
In the 1970s, oil displaced war as the primary cause of inflation.
In October 1973, members of the Organization of Arab Petroleum Exporting Countries (OPEC), led by Saudi Arabia, began an oil embargo to punish nations that supported Israel during the Yom Kippur War. By the time the embargo ended six months later, the price of oil was up by 300%.
This would be called the first oil crisis before the end of the decade. A second crisis began in 1979 when the Iranian Revolution led to a drop in production. Over the next year, the price of oil doubled.
The next crisis came in 1990 when Iraq invaded Kuwait and sent the price of oil higher. In 2007, global demand increased faster than supply as China’s economic growth accelerated more than experts had expected.
As the chart above shows, inflation was explained by an identifiable event; when the crisis passed, inflation would fall.
What Is the Cause Now?
This time it’s different.
Runaway government spending might be the cause of inflation. It could be the central banks pursuing aggressive policies and creating too much money. It is also possible inflation is a result of stimulus spending creating new demand that will power economic growth for years.
None of those causes will end quickly. This means inflation will continue until policymakers rein in their spending or the Federal Reserve stops printing money.
I’m not quitting anything…
I’m just showing people a new way to make money in the markets.
My typical approach targets setups in individual stocks. With roughly 3,000 U.S. stocks, there’s plenty of opportunity.
But my new approach has simplified everything and boiled the markets down to one repeatable trade in the same ticker symbol.
The annual return was 132% last year. Click here to see how we did it. And most importantly, how it could benefit you.
Michael Carr is a Chartered Market Technician for Banyan Hill Publishing and the Editor of One Trade, Peak Velocity Trader and Precision Profits. He teaches technical analysis and quantitative technical analysis at the New York Institute of Finance. Mr. Carr is also the former editor of the CMT Association newsletter, Technically Speaking.
Follow him on Twitter @MichaelCarrGuru.