VIX is known as the “Fear Index.”
Its more formal name is the CBOE Volatility Index.
VIX measures the expected volatility in the stock market over the next 30 days. It uses a complex formula based on the price of options on the S&P 500.
Volatility measures how much prices move, and larger price swings mean higher volatility. So VIX allows traders to profit from changes in volatility.
Volatility could be associated with up or down price swings.
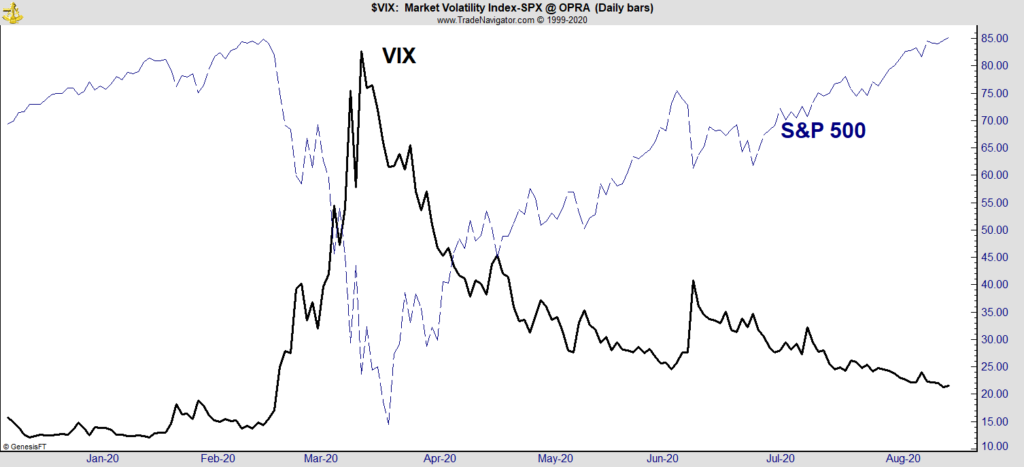
But, in general, volatility spikes when prices fall. You can see this in the chart below.
VIX (the black line) spiked higher as the S&P 500 Index (the blue line) fell earlier this year. As stocks recovered their losses, VIX fell.
2020: VIX Rises as Stocks Fall
Usually, VIX follows the price action.
But every four years, VIX takes the lead. And that’s happening now.
The Election Will Drive VIX Higher
VIX is based on the price of options that expire in about five weeks. Traders know that market volatility will start to increase near the end of September as the election drives the news cycle.
From now until late October, VIX will reflect election jitters.
News about polls will drive traders to make election-based decisions. And many traders will add options to their portfolio to address these risks. That will increase the price of options and drive VIX higher.
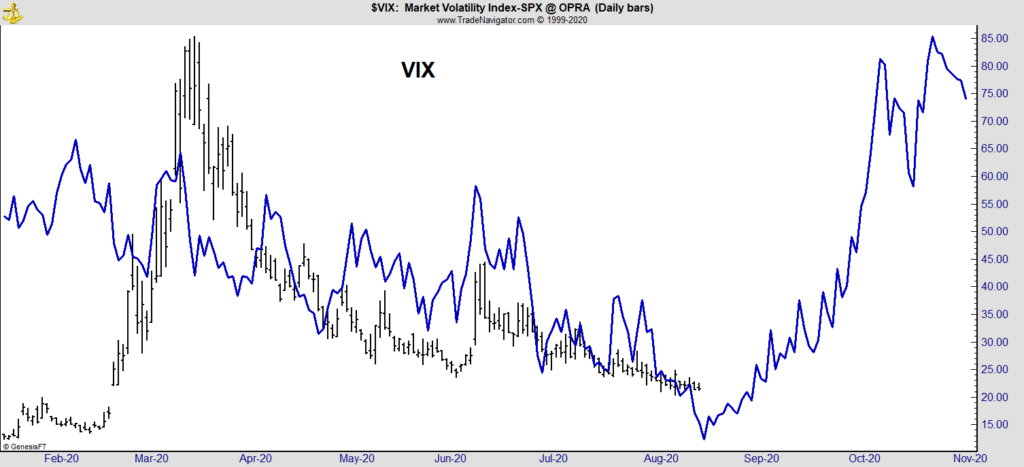
Now, this happens every four years, as the next chart shows.
VIX is the black line again, and the blue line is the seasonal trend of the index. The bottom in the seasonal trend occurred this week.
VIX Has Bottomed Out
For seasonal trends, the direction of the trend is more important than the value of the indicator.
In the past six months, VIX closely followed the seasonal trend. Now that trend turns sharply higher. That’s bearish for the stock market.
The blue line in the chart is based on the presidential cycle in the stock market and was calculated four years ago.
At that time, there was no way to know that Donald Trump would be president and his challenger would be Joe Biden. Given all the uncertainty involved in the market, it’s impressive that the seasonal trend has worked so well.
Seasonal strategies can be useful to investors. That’s why I use time as one of the components of my proprietary “Strike Zone” indicator. This cutting-edge investment system is based on my work with the Pentagon.
My strategy is simple, executing single trades with incredible accuracy. Anyone can use it to target gains of 100% or more.
To watch a short presentation about my “Strike Zone” indicator, click here.
Michael Carr is a Chartered Market Technician for Banyan Hill Publishing and the Editor of One Trade, Peak Velocity Trader and Precision Profits. He teaches technical analysis and quantitative technical analysis at New York Institute of Finance. Mr. Carr is also the former editor of the CMT Association newsletter, Technically Speaking.
Follow him on Twitter @MichaelCarrGuru.