Market risk can’t be directly measured. We never know if risk in a stock is precisely 11.3%, or something like that. The best we can do is identify general trends in risk or understand risk in historical context.
So, we can say risk is increasing, for example. Or we can say risk is at levels seen before the last two recessions. These statements are based on risk metrics like yield spreads.
A yield spread is the difference between interest rates on different bonds. A popular spread is the difference between 10-year Treasury notes and 13-week treasury bills. This spread made headlines after warning of a recession last summer.
The Baa-Treasury Spread
Also useful is the spread between corporate bonds and Treasurys. Analysts often follow the Baa-Treasury spread.
Baa bonds are rated as investment grade by Moody’s. Bond rating agencies like Moody’s review a company’s financial statements and the outlook for its industry to assign ratings.
Baa is the lowest investment grade rating, which means the bond has a low risk of default. Non-investment grade bonds are often called junk bonds.
The Baa-Treasury spread shows how much more high-quality companies pay to issue debt compared to the Treasury. It’s one way to look at risk.
Let’s say Baa bonds yield 2% and Treasurys yield 1%. The spread is 1%.
If investors believe risks are low, they won’t demand a large premium to own corporate bonds. In that case, the Baa yield bonds might fall to 1.5% while Treasurys stay at 1%. The spread drops to 0.5%, showing risks decreased.
When investors worry about risks increasing, the spread rises. Maybe Baa yields rise to 3%. With Treasurys at 1%, the spread increases to 2%.
The chart below shows the rate of change in the spread. It clearly shows if traders believe risk is rising or falling. The spread just moved up to recession levels.
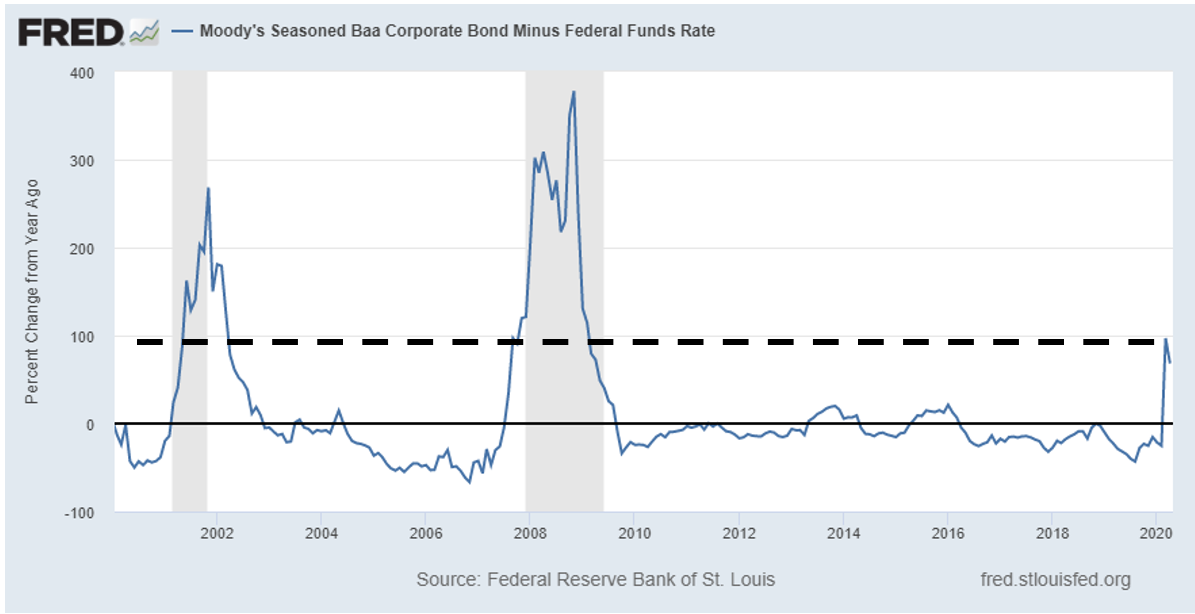
Source: Federal Reserve
The current reading of the Baa-Treasury spread, the dashed line, is consistent with a recession. The chart shows there were no false signals in the past 20 years. This spread only jumps when a recession is imminent.
Federal Reserve actions pushed the spread down in the past few weeks. Maybe the Fed can succeed in avoiding the recession. That hasn’t happened in the past 106 years, but there’s a first time for everything.
Stock market investors need to take note of this indicator. Stocks fell 50% or more the last two times this happened. It’s possible this time is different. But that is an expensive bet to place.
• Michael Carr is a Chartered Market Technician for Banyan Hill Publishing and the editor of Peak Velocity Trader and Precision Profits. He teaches technical analysis and quantitative technical analysis at New York Institute of Finance. Michael also is the former editor of the CMT Association newsletter Technically Speaking.
Follow him on Twitter @MichaelCarrGuru